

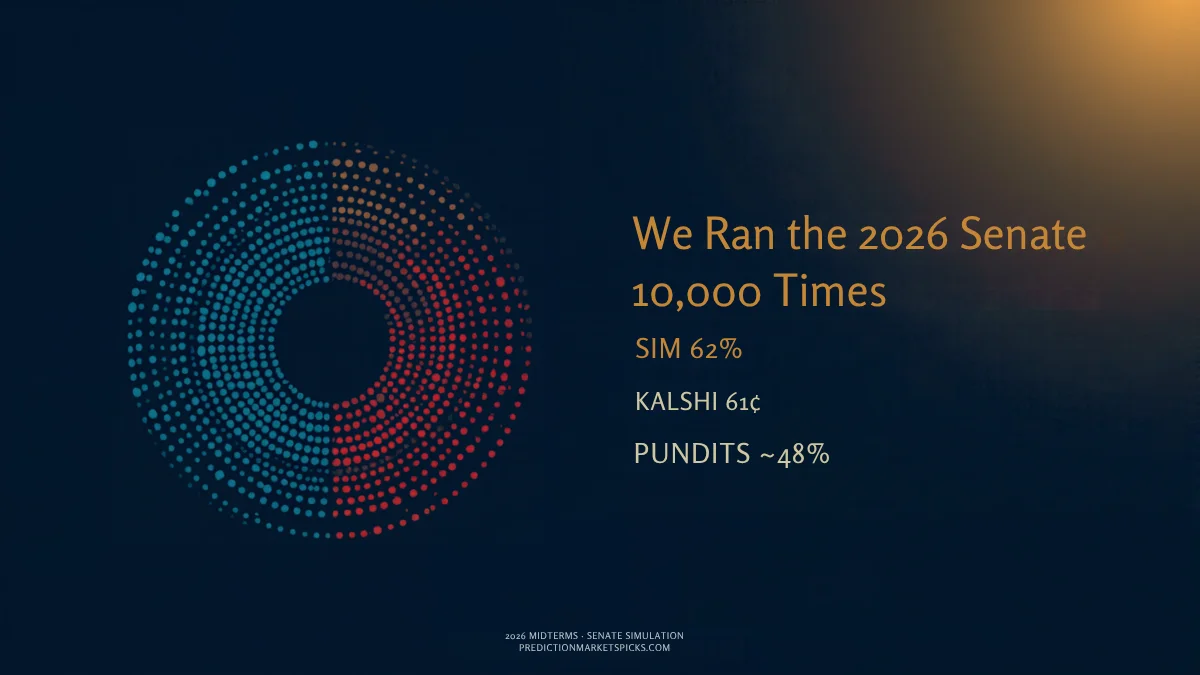
Democrats and independents keep the Senate in 62.5% of 10,000 simulated elections. Kalshi's balance-of-power market puts Democratic Senate control at 61¢. Two very different methods, a point and a half apart.
The forecasters are the outlier. We gave Cook, Sabato and Inside Elections the exact same treatment, turning each rating into a probability and running it through the same 10,000 elections. They land at 47.6%, 50.4% and 46.6%. That's a coin flip, 11 to 14 points below where the money is.
Here is where that gap comes from, which races decide it, and where our numbers and Kalshi's seat-count ladder don't line up.
See the biggest Senate market on Kalshi (Texas) →
The scoreboard
| Source | Dems + Ind control the Senate | Median Senate |
|---|---|---|
| PMP simulation (Kalshi race prices) | 62.5% | 52–48 |
| Kalshi balance-of-power market (D Senate control) | 61¢ | — |
| Sabato's Crystal Ball, simulated | 50.4% | 51–49 |
| Cook Political Report, simulated | 47.6% | 50–50 (R on the tiebreak) |
| Inside Elections, simulated | 46.6% | 50–50 (R on the tiebreak) |
Kalshi race and balance-of-power prices as of October 17, 2026. Forecaster ratings as published through October 15. Live board →
Simulate the 35 race prices with a national swing and you get a 52–48 median Senate and Democratic control in the low 60s. That is almost exactly what Kalshi's separate balance-of-power market says about the Senate. The market is consistent with itself.
Where the market and the pundits split
The gap isn't in the toss-ups. Every forecaster and the market agree that Iowa, Maine, Texas, Kansas and Ohio are close. The split is in the seats the ratings still call competitive and the market already treats as nearly decided:
| Seat | Kalshi (D) | Forecaster average (D) | Gap |
|---|---|---|---|
| North Carolina | 95¢ | 65% (Likely/Lean D) | +30 |
| Georgia | 95¢ | 70% (Likely/Lean D) | +25 |
| New Hampshire | 90¢ | 65% (Lean/Likely D) | +25 |
| Alaska | 75¢ | 53% (Toss-up/Lean D) | +22 |
| Minnesota | 87¢ | 65% (Lean/Likely D) | +22 |
| South Carolina | 16¢ | 30% (Lean/Likely R) | −14 |
Five Democratic-leaning seats where the market is 22 to 30 points more confident than the ratings. That's the whole difference between 62.5% and the forecasters' 47 to 50%. Rating categories like "Lean" and "Likely" are wide by design; a price isn't. If you think the forecasters are right to keep North Carolina and Georgia on the board, the Senate is a coin flip. If you think the market is right, it isn't.
We've broken down two of these on their own: Alaska, where the market and all three forecasters disagree, and the full markets-vs-pundits board tracks every seat as the ratings change.
There is no single tipping-point state. There are seven.
We called each competitive race for one side, reran the simulation both ways (4,000 runs each, on the same random draws), and measured how far Democratic control moved:
| Race | Called for the Democrat | Called for the Republican | Swing |
|---|---|---|---|
| Ohio | 67.4% | 55.6% | 11.8 pts |
| Michigan | 66.7% | 54.9% | 11.8 pts |
| Texas | 67.8% | 56.0% | 11.8 pts |
| Iowa | 70.2% | 58.6% | 11.6 pts |
| Maine | 68.3% | 56.8% | 11.6 pts |
| Kansas | 71.0% | 59.6% | 11.4 pts |
| Alaska | 65.5% | 54.3% | 11.3 pts |
Ohio edges the rest by a hair, but no race moves the chamber alone. That's why Texas draws the most money on the board (20.9M contracts open) without being any more decisive than Maine or Ohio. Texas just has the biggest names.
The Republican path, and the Democratic one
Five races sit between 35¢ and 65¢ right now: Ohio, Texas, Maine, Iowa and Kansas.
- Republicans win all five: they hold the Senate in 76.5% of simulations (median 49–51).
- Democrats win all five: Democrats and independents control it in 93.8% (median 54–46).
So the Republican path isn't a long shot. It runs through five races the market prices like coin flips, and a sweep of them is exactly what a national wave produces.
Do the races move together? The market says yes.
That's the one setting in the simulation that changes the answer. With every race treated as fully independent, Democrats control the Senate in 75.1% of runs. Add a shared national swing and the number drops: 62.5% at 35% shared, and 59.4% at 70%. The expected seat count barely moves (51.7 either way). What changes is how often all the close races break the same direction.
Kalshi's 61¢ balance-of-power read sits right where a meaningful national swing puts it. The market is pricing a wave risk, not just adding up 35 races.
Where our sim and Kalshi's seat ladder disagree
Kalshi also prices the exact number of Democratic seats. Compared with the simulation:
| Democratic + Ind seats | PMP simulation | Kalshi ladder |
|---|---|---|
| 50 | 10.2% | 13¢ |
| 51 | 11.3% | 13¢ |
| 52 | 11.3% | 17¢ |
| 53 or more | 39.9% | 35¢ ("Above 52") |
The ladder carries some overround (the bins add up to $1.06, not $1), so the 50 and 51 bins sit two to three cents above the simulation. The one that stands out is exactly 52 seats at 17¢ against an 11.3% simulated chance, a 6-point gap. On the other side, 53 or more simulates five points above its 35¢ price. If you're trading the ladder, those are the two strikes to check against your own read. Size any position with the Kelly calculator and run the fee-adjusted math in the EV calculator.
Run it yourself
The same simulation is live on our 2026 midterms page. Click any seat to call it for either side, slide the national swing, and watch the chamber rerun 10,000 times. It updates with Kalshi every hour, so the numbers above will move. The page has the current ones.
Trade the Texas Senate market on Kalshi →
How we ran it
- Races: all 35 Senate seats on the 2026 ballot, each priced at its Kalshi win probability (Democratic or independent side) as of October 17, 2026.
- Seats not up: 34 Democrats and independents, 31 Republicans. Control takes 51; a 50–50 split goes to Republicans on the vice president's tiebreak. Independents on the ballot in Nebraska (Dan Osborn), Montana, South Dakota and Idaho count toward the Democratic + independent total.
- Correlation: each simulated election draws one national swing shared by every race (35% of the variation) plus race-specific noise (65%). Every race still wins exactly as often as its price says.
- Forecasters: each rating converted to a probability: Toss-up 50%, Lean 60/40, Likely 75/25, Safe 90/10. Where a forecaster hasn't rated a safe seat, we used the average of the others. Then the same 10,000 elections.