

2026 Gridiron Edge is live — ratings, projections, and Week 6 model lines vs. Kalshi
Power ratings, MVP & championship edges, and every Week 6 game priced against the live prediction market.
NFL Prediction Market Analytics
DAEPA-powered game edges, team power rankings, and player projections — identifying where Kalshi is wrong on NFL markets.
59.6% accuracy · 3,266 games validated · Walk-forward backtest, no hindsight · Methodology →
This week on the boardNFL Week 6 predictions →NFL Week 7 predictions — early lines →Week 5 results →
Week 6 gamesSeahawks at BroncosTexans at JaguarsBears at FalconsRavens at BrownsTitans at ColtsJets at PatriotsSaints at GiantsPanthers at EaglesSteelers at BuccaneersCardinals at RamsChargers at ChiefsBills at RaidersCowboys at PackersCommanders at 49ers
Next up NFL Week 7 predictions
New · First-quarter report
64 games, 32 teams and what the prediction markets learned in Weeks 1–4. Plus a weekly data PDF, free with Pro. Read the report →
This Week's Model Lines vs Market
Week 6 · our DAEPA model line beside the live prediction-market price, every game · free


Model line = PMP Gridiron Edge favorite & spread (the model’s own read). Fair (books) = the market line win probability for that side, through the market's own win curve — the market's number, not the model's. Market = Kalshi-implied probability for the same side. Edge = Fair (books) − market, in percentage points. “QB pending” = held until both starting quarterbacks are confirmed; “held — review” = the model’s own line is too far from the market to publish. A dash means Kalshi has no two-sided book on that game right now.
Kalshi mids as of 4:20 PM ET · refreshed every 5 minutes
The draft’s over. Your agent isn’t.
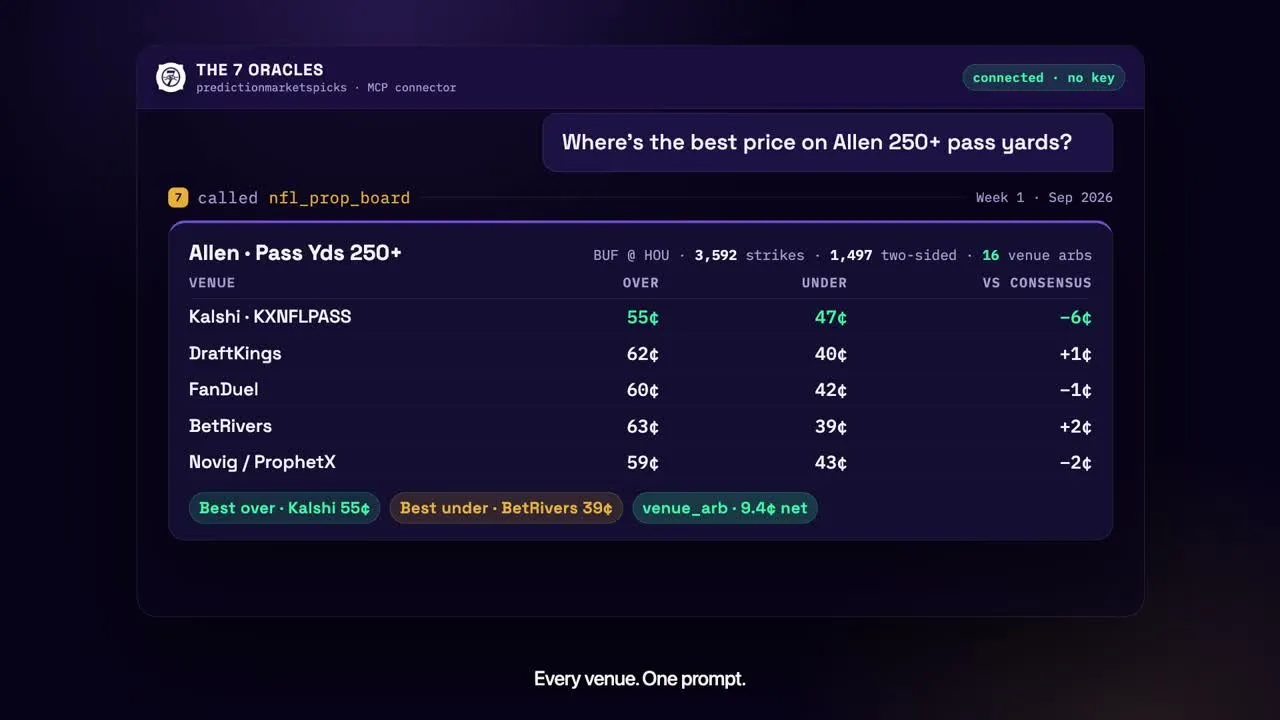
The same connector now prices the season: every Kalshi prop this week venue by venue, spread and win-total ladders against the whole model distribution, correlation-aware same-game combos, and the weekly game edges. The free tools answer with no key and no account.
 See the in-season NFL tools →Setup guide →Fantasy draft desk? Parked until the 2027 offseason.
The model’s top 10
PWR — points per game above an average team on a neutral field, from 27 seasons of opponent-adjusted EPA. Leader in gold.
1 Seahawks
+3.9
Playoff2
Seahawks
+3.9
Playoff2
 Patriots
+3.9
Playoff3
Patriots
+3.9
Playoff3
 Jaguars
+3.2
Playoff4
Jaguars
+3.2
Playoff4
 49ers
+2.8
Playoff5
49ers
+2.8
Playoff5
 Rams
+2.6
Playoff6
Rams
+2.6
Playoff6
 Bills
+2.4
Playoff7
Bills
+2.4
Playoff7
 Bears
+2.2
Playoff8
Bears
+2.2
Playoff8
 Ravens
+1.8
Playoff9
Ravens
+1.8
Playoff9
 Bengals
+1.5
Playoff10
Bengals
+1.5
Playoff10
 Packers
+1.4
Playoff
Packers
+1.4
Playoff
Where the model disagrees
Our win probability minus the live prediction-market price, in percentage points. Biggest gaps first.
 WAS @ SF
Fair value backs WAS · 25% vs 22% market
+4pp
MODERATE
DAL @ GB
Fair value backs GB · 55% vs 52% market
+4pp
MODERATE
WAS @ SF
Fair value backs WAS · 25% vs 22% market
+4pp
MODERATE
DAL @ GB
Fair value backs GB · 55% vs 52% market
+4pp
MODERATE
Informational only. Contracts can settle at $0 — verify the market and trade responsibly.
All 32 teams, live. Full power ratings →
Every team & division
All 32 teams →All NFL Tools
Everything Gridiron Edge publishes on the NFL — free tools, platform hubs, and Pro boards.
NFL Predictions
Free — experts vs. the market vs. our model, all 32 teams, graded weekly
Kalshi NFL Markets
Free — how Kalshi prices every NFL market + live model edges
Polymarket NFL
Free — Polymarket NFL lines, futures + US access
DraftKings Predictions NFL
Free — DraftKings’ CFTC prediction market for NFL
FanDuel Predicts NFL
Free — FanDuel’s CME-listed NFL event contracts
Robinhood NFL
Free — NFL event contracts + combos on Robinhood
Game Edges
FREEFree, always — moneyline + spread + total vs. Kalshi, every game
Player Props
Free top rows — our projection vs the Kalshi prop line
Player Pages
Free — every projected player: projection, Kalshi prop calls, market gap
The Ladder
Free — every Kalshi strike vs our whole distribution: spreads, season wins, props
Team Hubs
Free — all 32 teams: win total, schedule, market edge
Division Hubs
Free — all 8 divisions: odds, win totals, standings
Win Totals
Free — model vs Kalshi season win totals, all 32 teams
NFL Standings
Free — projected records + playoff odds, all 8 divisions
Schedule Predictor
Free — every game picked straight up, all 18 weeks + season sim
Schedule & Matchups
Free — all 18 weeks, every game: model vs. market
Power Rankings
All 32 teams on the points-per-game scale
NFL Power Ratings Tool
Free — PWR board for all 32 teams (agent-callable)
NFL Win Probability
Free — spread + total → win probability calculator
Player Projections
Weekly DAEPA + injury adjusted
Championship Edges
Playoff / conference / Super Bowl probabilities
Win Total Futures
Season wins vs. Kalshi line
MVP Edges
Live MVP market mispricings
2025 Season in Review
RZ conversion, RB opportunity share, passing efficiency →
Methodology
59.6% accuracy, explained
Fantasy Draft Kit
Free — 2026 sleepers & busts vs. consensus ADP
Best Ball ADP Values
Free — most over- & underdrafted players on Underdog
Gridiron Edge — NFL Analytics FAQ
What is Gridiron Edge?
Gridiron Edge is an NFL analytics system built on Defense-Adjusted EPA (DAEPA), a proprietary metric that adjusts a team's efficiency for the quality of opponents faced. It identifies edges between DAEPA-implied win probabilities and Kalshi prediction market prices.
How does Gridiron Edge find NFL prediction market edges?
Gridiron Edge prices every game at a fair value anchored to the books' line, then compares it with the current Kalshi contract price. A game is flagged as a position when the two disagree by 2 points net of the book's spread, and only once both starting quarterbacks are confirmed. Our own ratings line is published separately as a lean in points and graded on its own, never as a position. These are screens, not picks: a flag can drop off when the price moves.
How accurate is Gridiron Edge?
In a walk-forward backtest of 3,266 NFL games from 2013–2024, Gridiron Edge achieved 59.6% straight-up win prediction accuracy with a 0.236 Brier score and a 0.664 log loss, using no market line as an input. Accuracy is not flat across its own confidence levels: it runs 51.6% on toss-ups and 71.5% on the games where the model flags an edge above 20%. That gradient, not the headline number, is what makes the model useful next to a market price.
Do I need to be a Pro subscriber to use Gridiron Edge?
Game edges are free — moneyline, spread and total against the Kalshi price on every game, no signup. Player projections, win total futures and championship probabilities show their top rows free; the full boards are Pro at $14.99/month or $150/year. Power rankings and the methodology page are free year-round.
The Week 6 card, Thursday morning — our model against the Kalshi board, free to your inbox.
No spam. Unsubscribe anytime.
Game edges are free. Always.
Model win probability against the Kalshi price on every game, every week — no signup. Futures, championship and projections keep their top rows free. Pro is the layer around them: edge alerts in Discord the moment a gap opens, every prop edge, Thee Oracle, the commodity and crypto engines, and agent access to the same model over MCP.
More NFL model boards
- NFL Week 6 predictions — Model vs. Kalshi on every game on the board right now.
- NFL Week 7 predictions — early lines — Next week’s slate, priced the moment the lines open.
- NFL Week 5 results — Final scores and every graded call from the week just played.
- Will Derrick Henry score a TD? Live Kalshi odds → — Henry anytime TD, 2+ TDs and rushing-yard prices for every Ravens game, plus his TD record vs the market
- Markets 101: be the market maker, not the market taker → — Why the first-TD board prices out to ~118%, and how a resting bid a cent under the ask beats paying it
- Heisman odds 2026 — Kalshi vs Polymarket → — Every contender priced on both exchanges, cheaper venue named, plus Coach Gene’s longshots
- Grok fantasy football — connect the draft desk → — One URL, no key: the grok.com/connectors walkthrough and six prompts
- NFL MCP server — the in-season desk, inside your AI agent → — Kalshi props venue by venue, spread ladders, correlation-aware combos, weekly game edges — free tools, no key
- MCP setup — connect Claude, ChatGPT or Grok in a minute → — One URL, no API key: per-host install steps and troubleshooting
- NFL 2026 Market Guide — the 61-page book → — All 32 teams priced against the market, plus a 153-player draft board
- NFL 2026 Quarter-Season Report — 64 games, 32 teams, priced → — Weeks 1–4 in one book: opening vs closing lines, the Kalshi board Sept 8 vs Oct 8, all 32 team cards
- NFL Player Props vs Kalshi — the edge board → — Our projection vs the live Kalshi prop line, biggest gap first
- Madden 27 ratings vs our model vs the market → — All 32 team ratings, our power ratings, and live win-total prices on one board
- NFL Predictions — every game vs the market → — Free fair value vs Kalshi on all 18 weeks
- 2026 NFL Win Totals — model vs Kalshi → — All 32 teams: projected wins vs the KXNFLWINS ladder
- NFL Standings 2026 — projected records + playoff odds → — All 8 divisions: projected record, PWR, division-title and playoff odds
- NFL Schedule Predictor 2026 — every game picked → — Straight-up winner and win probability for all 272 games, plus the 10,000-season sim
- NFL Game Edges — where the model disagrees → — Moneyline, spread & total edges vs Kalshi prices
- NFL MVP Edges → — Live MVP market mispricings vs Kalshi KXNFLMVP
- Win Total Futures → — Monte Carlo season wins vs the Kalshi line
- Championship Edges → — Playoff / conference / Super Bowl probabilities
- Kalshi NFL Markets → — How Kalshi prices every NFL market + live edges
- Power Rankings — the model methodology anchor → — All 32 teams on the points-per-game scale
- Fantasy Draft Assistant — the same model, in your AI agent → — Free MCP draft desk: board, best available, sleepers vs ADP, who-do-I-draft
- NFL Model Calibration Ledger — how accurate is it, actually → — The graded record: 59.6% straight up, 0.236 Brier, and hit rate by confidence bucket across 3,266 games
- NFL Power Ratings tool — build your own PWR board → — Adjust the model weights and re-rank all 32 teams on the points-per-game scale
- NFL Win Probability calculator → — Turn any rating gap, spread or moneyline into a calibrated win probability
- NFL Power Ratings vs. the Market — where we disagree → — Our PWR and the rating implied by live Kalshi win-total prices, all 32 teams on one points scale