

> Note, 2026-08-21. For part of today this piece carried different figures. We had found our published board disagreeing with itself and corrected the article to match the version on the site — then discovered the site's board was the one at fault: it was being built without the full offseason roster picture. With that fixed and the model re-run, the original numbers below are the correct ones again, with two exceptions now updated: Kansas City sits 19th rather than 20th, and the market column has been re-read at today's prices. What changed and why.
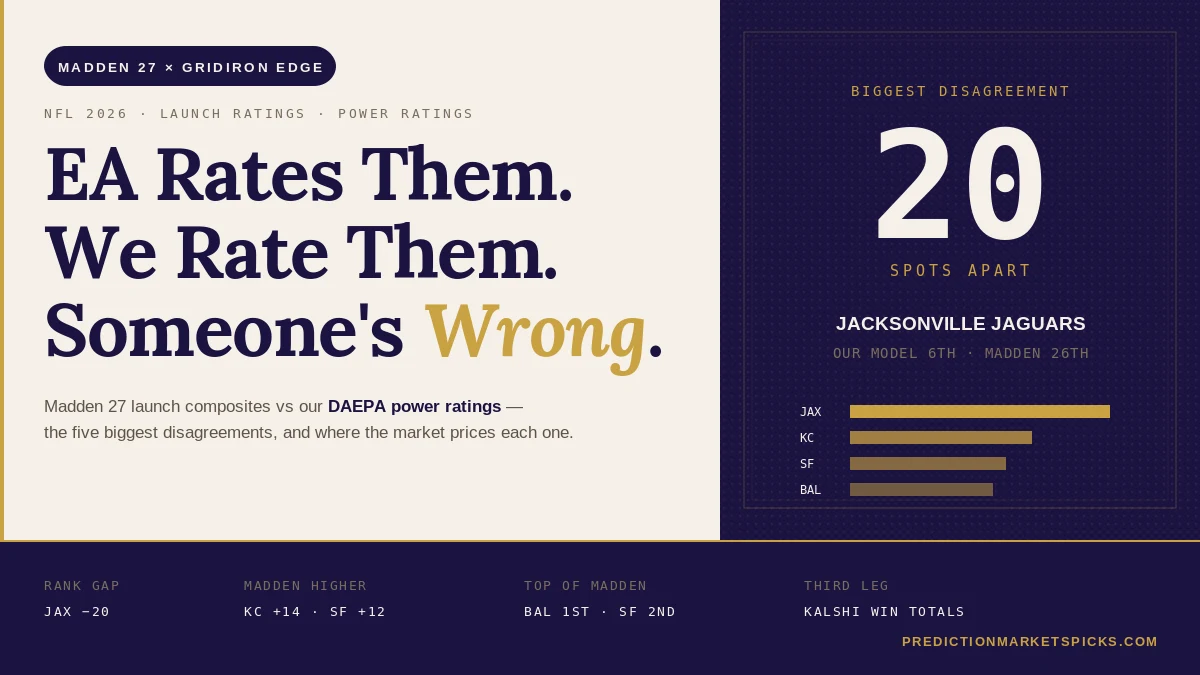
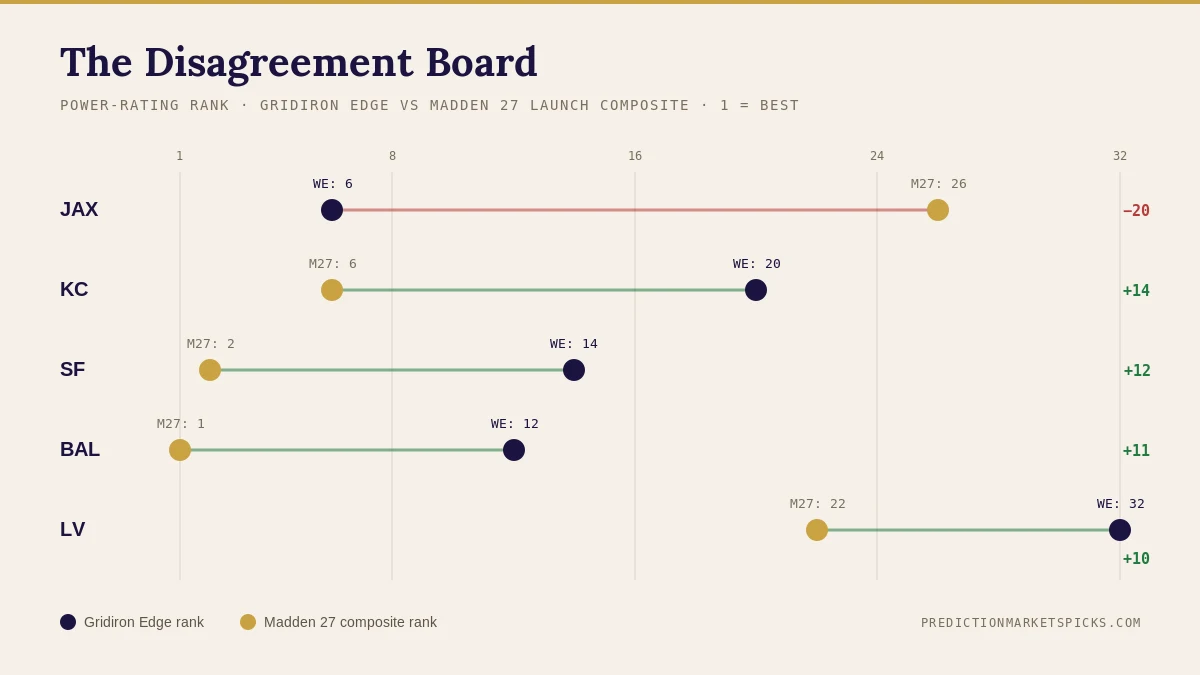
EA rates the Jacksonville Jaguars 26th in Madden 27. Our power rating has them 6th. That is a twenty-spot disagreement about the same football team, and it is the widest gap on the board.
Madden 27's ratings database went live this week, which makes it the one moment each year when a video game and a play-by-play model can be put side by side on all 32 rosters. Mostly they agree. Where they don't, the disagreement is usually informative about how each side decides what "good" means — and this year the five biggest gaps all point at the same underlying split.
What each side is actually measuring
Madden rates players. A team number is a composite of the individuals on the roster — EA's scouts grading arm strength, speed, awareness, and a heavy dose of reputation. It is a talent snapshot, and it knows nothing about scheme, coaching, or what happened on the field last September. We build our composite from the top-rated starters in nine position groups and z-score it within its own edition, because ratings inflate over time and a Madden 88 in 2012 is not a Madden 88 in 2026.
Our power rating does the opposite. It starts from roughly 1.3 million plays of play-by-play, computes a defense-adjusted EPA for every team, and iterates an opponent adjustment until it converges. It has no opinion about whether a player is famous. It scores what the roster produced, against who it produced it against.
So one measures the names on the jersey and the other measures the results on the tape. Most of the time those land in the same neighborhood. Five times this year they don't.
The five disagreements
| Team | Our rank | Madden 27 | Gap |
|---|---|---|---|
| JAX | 6 | 26 | 20 |
| KC | 19 | 6 | 13 |
| SF | 14 | 2 | 12 |
| BAL | 12 | 1 | 11 |
| LV | 32 | 22 | 10 |
Jacksonville — the one where we're the outlier
This is the story of the board. Our model has the Jaguars sixth; Madden has them 26th. Nobody else on the list is even close to a twenty-spot gap.
The mechanism is exactly the split described above. Jacksonville does not have a roster that reads impressively position by position — there is no 99-overall anchor, and the depth chart is full of players EA's scouts have no strong reason to love. What Jacksonville did have was production: they graded out well on a per-play basis against the schedule they actually played, and a model that only counts plays rewards that without caring whose name is attached.
It is worth being honest about which direction the risk runs here. A twenty-spot gap where we are the high side means we are the ones making the unusual claim. Our model is the one that has to be right.
Kansas City, San Francisco, Baltimore — Madden loves the names
These three run the other way, and they cluster for the same reason. Madden has San Francisco 2nd and Baltimore 1st; we have them 14th and 12th. Kansas City is 6th for EA and 19th for us.
All three carry rosters stacked with recognizable, highly-rated individuals — the kind of names that produce a strong composite whether or not last season's per-play results backed it up. Our model saw the results and marked them down. Baltimore in particular is the cleanest case: EA's single highest-rated roster in the game, and a team our defense-adjusted numbers rated squarely mid-pack.
Las Vegas — everyone agrees it's bad, they disagree how bad
We have the Raiders dead last at 32. Madden has them 22nd. This is the least interesting gap on the list, because it is a disagreement about degree rather than direction. Both sides think Las Vegas is a bottom-third roster; only one of them thinks they're the worst in the league.
The third leg: what the market says
Two opinions is an argument. Three is a data point. So here is where Kalshi's win-total ladders priced these five teams at the time of writing — reading the full ladder as a distribution and backing out an implied expected win total, rather than quoting a single rung.
| Team | Our projected wins | Madden-sim wins | Market implied |
|---|---|---|---|
| JAX | 9.5 | 7.0 | 9.1 |
| KC | 8.2 | 10.0 | 9.7 |
| SF | 8.8 | 10.5 | 9.6 |
| BAL | 9.2 | 11.0 | 10.3 |
| LV | 5.7 | 7.8 | 6.2 |
Look at that middle column against the other two. On all five of the biggest disagreements, the market lands between us and Madden. Not once does it take a side outright.
That is a genuinely humbling result, and it is the most useful thing in this article. Traders with real money on the line are, in every one of these five cases, splitting the difference between a talent-based read and a results-based one. Where we are most confident Jacksonville is good, the market is a full win below us. Where Madden is most confident Baltimore is elite, the market is more than a win below Madden.
The Madden-sim column, incidentally, comes from running the season ten thousand times on nothing but those launch ratings — the same exercise, played forward.
So who's usually right?
We backtested this properly rather than guessing, across 4,237 games from 2010 to 2025.
A model built only from preseason Madden composites picks NFL winners straight up 61.0% of the time. The closing market line, on the same games, gets 66.2%. Madden's Brier score of 0.232 lands about 90% of the way from a coin flip to the closing line — which is a genuinely surprising amount of signal to find sitting in a video game every August, for free.
But it does not beat the market. Against the spread it graded 51.3% over a full season, under the 52.4% breakeven. The one place it showed real life was early: 53.6% through Weeks 1–9, before decaying as the market absorbs actual in-season information.
Which raises the obvious question, and we tested that too: should we fold Madden into our own ratings for the opening weeks? We fitted that weight across 947 games and the answer was no. The best weight in the entire sweep moved Brier by 0.0007 with a confidence interval straddling zero, and against the closing spread it made things monotonically worse. The fitted weight is zero and we did not ship it. Madden's composite predicts wins fine on its own; it simply doesn't tell a play-by-play prior anything that prior doesn't already know.
What we're watching in Weeks 1–4
The nice thing about a disagreement this sharp is that it settles itself quickly. Three Week 1 games put the argument straight on the field:
- Cleveland at Jacksonville — the twenty-spot gap gets its first data point.
- San Francisco at the Rams — Madden's number two roster against the team our model has third.
- Baltimore at Indianapolis — EA's highest-rated team in the game, against a model that has them 12th.
We'll be reading those against the full Madden 27 board, where every team's EA composite sits next to our rating and the live market price. If you want to build a position off any of these disagreements, the Combo Edge Builder will grade the legs and flag correlation traps before you commit.
One prediction we're comfortable making: by Week 5 this article will look either very smart or very silly about Jacksonville, and not much in between.
Educational analysis, not financial advice. Model outputs are estimates, not guarantees — trade responsibly.