

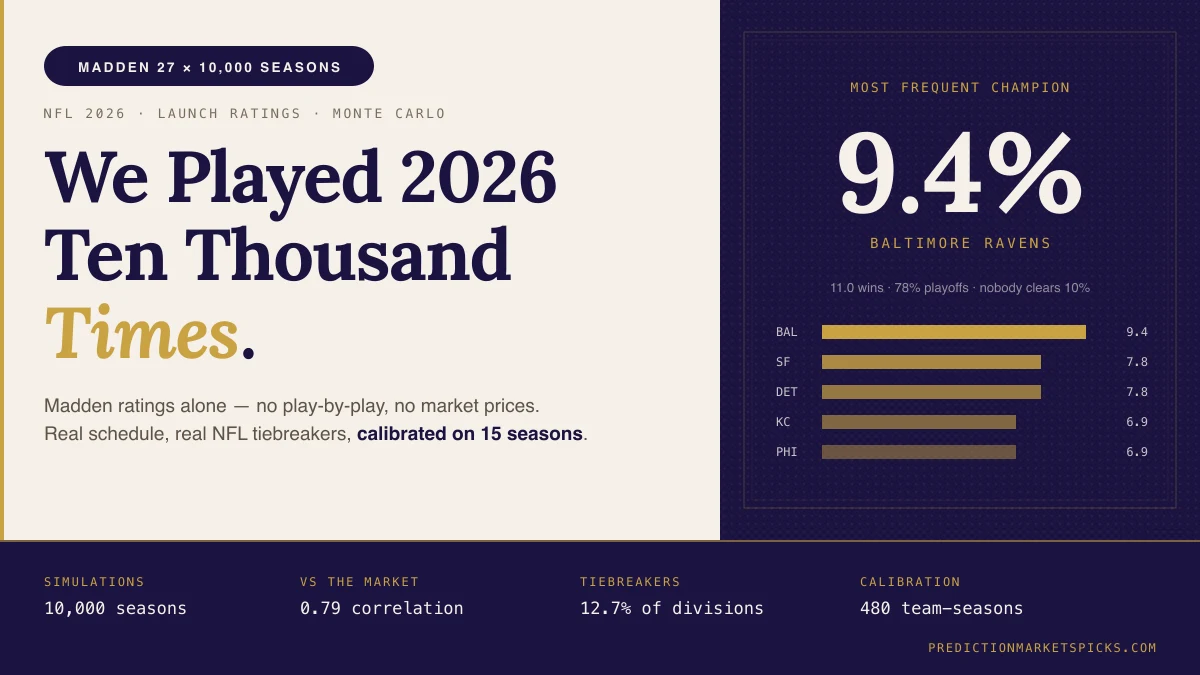
Baltimore wins the Super Bowl in 9.4% of them.
That is the headline from ten thousand simulated 2026 NFL seasons built out of nothing except Madden 27 launch ratings. No play-by-play, no market prices, no injury news. Just EA's opinion of who is good, played forward across the real schedule ten thousand times.
The engine underneath it is the same one that powers the rest of the NFL work on PredictionMarketsPicks. My job was to point it at a different input — and then spend a lot of time finding out why my first three versions were wrong.
What the simulation actually does
Three ingredients.
A number for each team. For every club we take the top-rated starters in nine position groups — quarterback, running back, receiver, tight end, offensive line, pass rush, linebacker, secondary, special teams — and average them into one composite. Then we z-score that composite within its own Madden edition, because ratings inflate over time and a Madden 88 in 2012 is not a Madden 88 in 2026. We're only ever comparing a team to its peers in the same game.
A way to play a game. That composite gets converted into points by fitting it against 3,903 real NFL games from 2010 to 2024:
margin = 2.82 × (rating gap) + 2.0 home-field pointsTwo points of home field and about fourteen points of single-game randomness. Those weren't chosen — they fell out of the fit — and they happen to be almost exactly what the NFL actually runs, which was the first sign the thing wasn't broken.
The real schedule. All 272 games, actual 2026 opponents, neutral-site games get no home field.
Then we play the season, seed the playoffs, run the bracket, and write down what happened. Ten thousand times.
If you just want the numbers for your team, they're all on the Madden 27 ratings board — every club, our rating next to EA's, and what the market thinks.
The mistake that made me redo it
My first version drew every game independently. Same team, same average, seventeen separate coin flips.
That's wrong, and it took me embarrassingly long to see why. It says a twelve-win roster is exactly as likely to lay an egg in Week 12 as in Week 1 — that every game is a fresh start. Real teams aren't like that. They're good or bad all year. Something is either working or it isn't.
So now each team's true strength gets drawn once per simulated season and used for all seventeen games. Which meant I had to answer a question I hadn't thought about: how wrong is a Madden rating, actually?
We measured it. For every historical season, you can solve backwards from real results to get what each team's strength actually was, then compare that to what Madden said in August. Do that across 480 team-seasons and the gap is about 4.3 points. That's the number the simulation now carries around as "we might be this wrong about any given team."
For comparison, our own play-by-play model is off by about 3.4. So Madden is a noisier starting point than a real model — which is what you'd expect, and it's better to measure that than to assume it.
The effect wasn't small. Before I fixed it, the simulation had Baltimore at 15.1% to win the Super Bowl. Once it accounted for "we might just be wrong about Baltimore," that fell to 9.4%. The first version wasn't more confident because it knew more. It was more confident because it was treating a video-game rating as the truth.
Baltimore, and the gap between a roster and a season
The Ravens have the best roster in the game by our composite — 84.6, with Lamar Jackson at a 94 — and the simulation likes them everywhere. Most wins, best playoff rate, most No. 1 seeds.
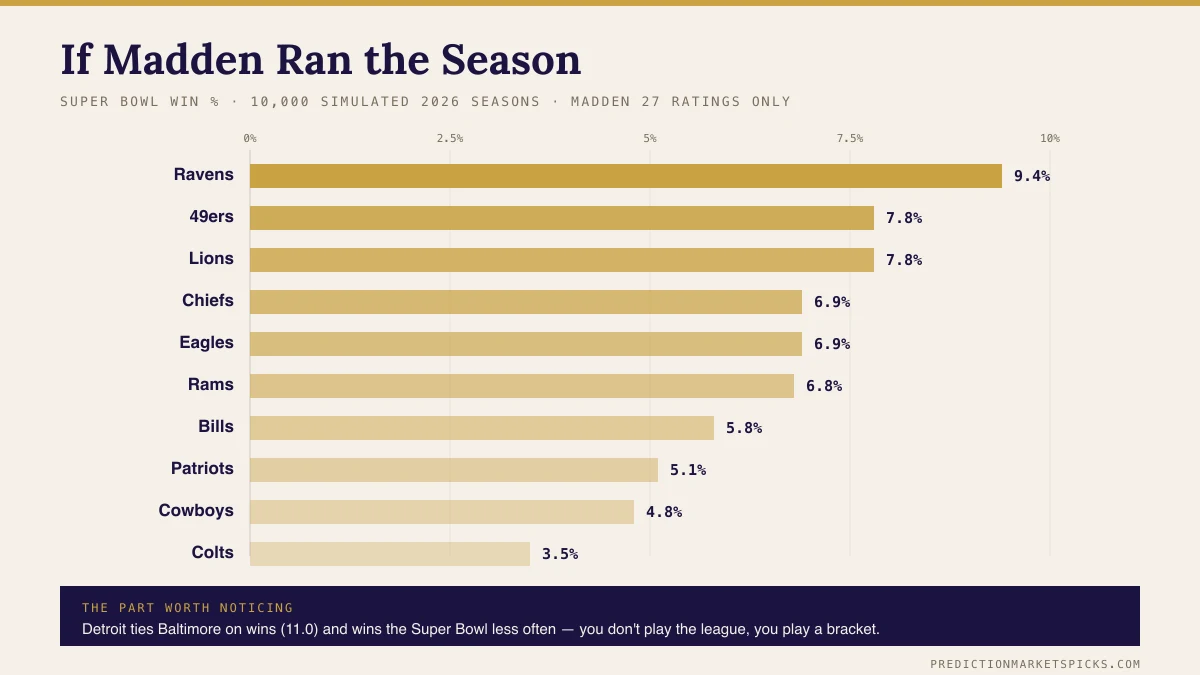
The part I keep coming back to is Detroit. The Lions tie Baltimore on average wins, 11.0 to 11.0, and win the Super Bowl less often. Same expected season, worse expected ending.
That's not noise. It's the NFC. Detroit has to get through San Francisco, Philadelphia and the Rams — three of the top six rosters in the game — while Baltimore's conference has Kansas City and then a real drop. Two teams can be equally good and not have equally good odds, because you don't play the league, you play a bracket.
Nobody clears 10%, either. The most likely single outcome out of ten thousand seasons is still "somebody other than Baltimore," about 91% of the time. That's the NFL.
The divisions Madden can't call
| Division | Favorite | Next | |
|---|---|---|---|
| AFC North | BAL | 52.3% | CIN 20.8% |
| NFC North | DET | 48.6% | CHI 21.3% |
| NFC East | PHI | 47.2% | DAL 34.0% |
| AFC East | NE | 43.6% | BUF 42.1% |
| AFC South | IND | 43.0% | HOU 31.9% |
| AFC West | KC | 41.5% | DEN 23.2% |
| NFC West | SF | 40.6% | LAR 32.9% |
| NFC South | ATL | 34.5% | TB 28.6% |
Baltimore is the only club in football that Madden makes better than a coin flip to win its own division.
Two of these are basically ties. The AFC East is 43.6 to 42.1 — New England and Buffalo, and the gap is smaller than the rounding on a Madden rating. The NFC South tops out at 34.5%, which is the simulation saying it genuinely does not know; Atlanta is the "favorite" the way the tallest person in a short room is tall.
Tiebreakers turned out to matter more than I thought
I originally broke ties on point differential because it was easy. Then I checked how often ties actually happen.
12.7% of division titles in our simulations come down to a tiebreaker. Roughly one division in eight, every season. Tied groups get as deep as seven teams.
So a shortcut there isn't a rounding error — it's inventing the winner of a division title once every eight tries. The simulation now runs the real NFL procedure: head-to-head, then division record, then common games, then conference record, then strength of victory, then strength of schedule. Multi-team ties resolve the way the league does it, where knocking one team out sends everyone else back to the start of the list. If it's still tied after all of that, it's a coin flip, which is also what the NFL does.
Strength of schedule falls out of that work for free, so: Arizona and Miami have the hardest 2026 schedules (.528) and Detroit has the easiest (.467). Which makes Detroit's 11.0 wins slightly less impressive and Miami's 5.5 slightly less damning.
Where Madden and the market disagree
The simulation doesn't know anything about prices. So the obvious next question is whether it disagrees with people who have money on it.
Kalshi lists a win-total ladder for every team — a separate contract for "more than 5 wins", "more than 6 wins", and so on up the board. Add those probabilities up and you get what the market expects a team to win.
One catch worth explaining, because it's the kind of thing that quietly breaks a comparison. Add up the market's expected wins across all 32 teams and you get 301.7. An NFL season only has 272 wins in it — every game produces exactly one. The gap is the spread between what you can buy and sell each contract for, which shows up as extra probability everywhere. So I scaled the whole board down by about 10% to make it add to 272 before comparing anything. Otherwise Madden looks pessimistic about all 32 teams, which isn't a finding, it's an accounting error.
Once both sides add up to the same 272:
| Team | Madden sim | Market | Gap | |
|---|---|---|---|---|
| Madden higher | ARI | 7.3 | 5.0 | +2.2 |
| IND | 9.4 | 7.9 | +1.5 | |
| ATL | 8.5 | 7.1 | +1.4 | |
| BAL | 11.0 | 10.0 | +1.1 | |
| Market higher | LAR | 10.0 | 11.2 | −1.2 |
| SEA | 8.8 | 9.9 | −1.1 | |
| LAC | 8.2 | 9.3 | −1.1 | |
| JAX | 7.0 | 8.9 | −1.9 |
They agree more than they disagree — the correlation across all 32 teams is 0.79, and the average gap is 0.83 wins. A video game and a market full of traders broadly see the same league, which I did not expect going in.
The disagreements are where it gets interesting.
Arizona is the biggest gap on the board. Madden has the Cardinals at 7.3 wins; the market says 5.0. Worth noting our simulation already knows Arizona has the hardest schedule in football (.528 opponent win rate, hardest of all 32) and still likes them more than the market does. So it isn't that the sim missed the schedule. It's that EA rates that roster considerably higher than the people pricing it do.
Jacksonville is the same argument in reverse, and it's the one I'd actually look at. Madden has the Jaguars 26th in the league on talent and gives them 7.0 wins. The market says 8.9. Our own play-by-play model — which had nothing to do with this simulation — has them 6th.
So on the Jaguars, Madden is alone. The market and our model both like them; the video game doesn't. When two independent things disagree with the third, the third is usually the one that's wrong.
Does any of this actually work?
This is the part I'd want to see if someone handed me a simulation, so it's the part I spent longest on.
We replayed every season from 2010 to 2024. Build that year's Madden composites, run the whole simulation against that year's real schedule, and check where the actual result landed inside our predicted range. 480 team-seasons.
| Result | Should be | |
|---|---|---|
| Average error, win total | 2.27 wins | — |
| Predicted 20–40% playoff odds | 28.9% happened | 20–40% |
| Predicted 60–80% playoff odds | 70.3% happened | 60–80% |
| 80% range contained reality | 85.4% | 85.4% |
That last row is the one I'm proudest of, and it needed a second look to understand. Our 80% range contained the truth 85.4% of the time, and my first instinct was that the model was too cautious. But win totals are whole numbers, so a range like that always catches a bit more than it advertises. We checked what a perfect model would score on the same test — 85.4%. We matched it exactly.
In plain terms: when this thing says 60%, it happens about 60% of the time. That's the only claim I'd actually defend.
What it doesn't know
It uses the launch roster and never updates. No injuries, no trades, no in-season moves. No coaching, no scheme, no weather, no short weeks. Strength of schedule is real, but it doesn't know whether the team you're playing will be healthy when you get there.
And the average miss on a single team is 2.27 wins. So if you take one number off this page and treat it as a prediction, that's on you — the distribution is the product. The average is just the middle of it.
Full disclosure on the Jets
The simulation gives the Jets 6.66 average wins and a 37.2% chance of reaching eight.
I mention it because part of my compensation here is a year of Xbox Live that I keep only if the Jets don't win eight games. So the model I built says I'm about a 63% favorite to keep it.
I want to be clear that I did not build it that way on purpose, and that I checked twice.
We'll grade this in January — every win total, every division, the whole leaderboard, against what actually happened. It's easy to publish a simulation in August. The useful part is showing up in the winter with the scorecard, so that's the plan.
Dylan Ricciardi is an analyst intern at PredictionMarketsPicks and a senior at High Technology High School, class of 2027, where he's headed toward data analytics. Methodology, source code and the full calibration record are in the repo — the numbers here are reproducible from a seed.