

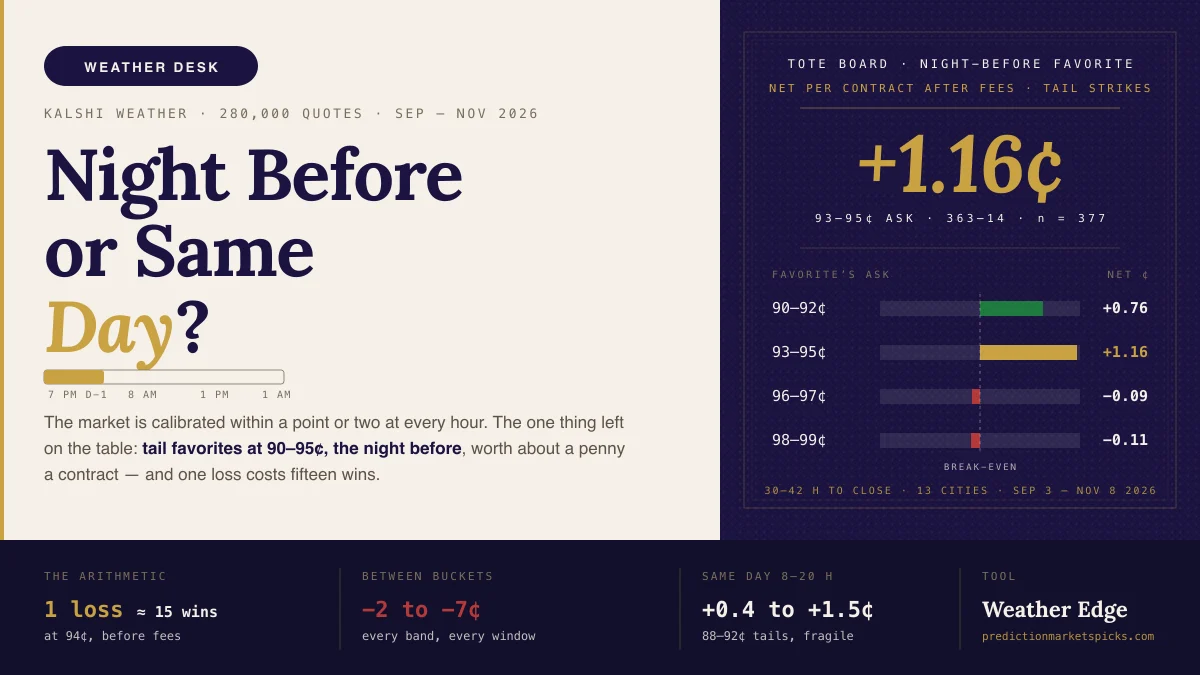
Every weather trader asks the same thing: when do I get in? We have 280,000 Kalshi quotes, logged every five minutes across 13 cities from September to November, that answer it.
The night before is the only window where the market leaves anything on the table, and only on favorites already priced in the nineties: about a penny a contract. By 8 AM the model runs have landed. By 1 PM the people with one-minute station feeds own it. After dark the answer is already in the evening report.
The market is calibrated almost everywhere
Take every quote with a two-sided book and a spread of ten cents or less, one per contract per hour, and ask one question of the side priced above fifty cents: how often did it win compared with what it cost? The answer is the market's calibration error in points, by hours to close and by price.
| Hours to close | 90–93¢ | 93–97¢ | 97–100¢ | 75–85¢ | 50–65¢ |
|---|---|---|---|---|---|
| 36 h or more (night before) | +1.1 | +2.0 | +1.2 | −4.3 | −0.7 |
| 27–36 h | +0.1 | +0.2 | +1.1 | −0.8 | −1.4 |
| 18–27 h | +1.6 | −1.8 | +0.4 | −2.5 | −0.4 |
| 12–18 h | +2.4 | −0.1 | +0.6 | +4.0 | +1.0 |
| 8–12 h | +2.9 | +0.6 | +0.5 | +2.8 | −0.6 |
Positive means the favorite won more often than its price implied. Read across the table and the market is within a point or two of correct nearly everywhere. The one consistent exception is the top of the ladder: the side priced above ninety cents has run slightly cheap at every horizon, and most clearly the night before.
That pattern has a name, the favorite-longshot bias, and a cause. Retail flow buys the tails because a six-cent contract that pays a dollar feels like the trade worth making. Someone has to sell it to them, and the someone is paid in the two points the favorite runs cheap.
Turned into trades
Calibration is a statistic; a trade has a fill price and a fee. We replayed the favorite rule properly: take the first quote in each window with the favorite's ask inside the band, pay the ask, pay Kalshi's taker fee at the fill, hold to settlement.
| Window | Favorite's ask | Tail strikes: n · record · net per contract | Between buckets: n · record · net |
|---|---|---|---|
| Night before, 30–42 h | 90–92¢ | 268 · 249–19 · +0.76¢ | 79 · 67–12 · −6.95¢ |
| 93–95¢ | 377 · 363–14 · +1.16¢ | 95 · 88–7 · −2.38¢ | |
| 96–97¢ | 523 · 510–13 · −0.09¢ | 82 · 78–4 · −2.30¢ | |
| 98–99¢ | 1,119 · 1,113–6 · −0.11¢ | 120 · 117–3 · −2.04¢ | |
| 88–89¢ | 172 · 152–20 · −1.17¢ | 60 · 50–10 · −6.27¢ | |
| 20–30 h | 93–95¢ | 138 · 132–6 · +0.43¢ (every other band negative) | all negative |
| Same day, 8–20 h | 88–92¢ | 622 · 571–51 · +0.4 to +1.5¢ | all negative |
The edge lives in one place: tail strikes, the night before, with the ask at 90 to 95 cents. Above 96 the fee eats it. Below 90 the losses arrive too often. The two-degree between buckets lose at every price, because a bucket favorite asks the night-before forecast for precision rather than direction — it needs the high to land inside two degrees, and a front, a sea breeze or a cloud deck moves it out.
Our bot ran a looser version of this on paper from October 31 to November 8, taking favorites from 90 to 97 cents: 38 settled, 36 wins and 2 losses, average cost 94.3 cents, net −0.61 cents a contract. Both losses were 90-cent entries. Consistent with the replay: the edge is at 90–95, and it dies above 96.
One loss costs fifteen wins
At 94 cents a winner clears six cents before the fee and a loser costs 94. The rule needs roughly fifteen wins per loss to break even, which is why a 96% hit rate reads as a penny of edge and a 93% hit rate reads as a disaster. The favorite's calibration at that price is the whole trade. Over 645 night-before trades at 90–95 cents it held, 94.9% paid; over a full year across 24 cities we have not yet replayed it, and until we have, this runs on paper and the record is published as it accrues.
Town matters more than you would think. Over the two autumn months of our 24-city candle archive, night-before favorites made money both months in Boston, Chicago, Denver, Miami, San Antonio and Atlanta, and lost both months in Austin and Dallas, where a Texas front that arrives six hours early turns a 94-cent "high above 81" into a loss. Chicago and Atlanta are the tightest stations, with forecast errors of about a degree and a half to two degrees the night before; Los Angeles and Boston are the widest at three to four. A 93-cent tail in a tight town is really a 97-cent tail; in a loose one it is really 90. The station's own error at the horizon, not the price alone, is what makes the band.
Hour by hour, what moves the price
| Window | Kalshi | What drives the price |
|---|---|---|
| Listing to about 7 PM local the day before (30–42 h) | The only structural edge: tails at 90–95¢, +0.8 to +1.2¢ | Model runs plus yesterday's observations; retail buys the tails |
| 20–30 h (late night, early morning) | Break-even | The 00Z and 06Z model runs land; automated traders pin the book |
| Same day, 8–20 h | 88–92¢ tails +0.4 to +1.5¢, fragile | Live observations and one-minute feeds; the market's miss falls from 1.3°F to under 0.9°F |
| Evening, 6:30 PM to the 1 AM close | Thin | The 00Z six-hour maximum, the midnight daily summary, the preliminary Climate Report |
The same-day number tells the story of who is in the room. Between 11 AM and 2 PM local, the market's implied high misses the official number by about a degree; after 3 PM, by well under one. NOAA's blend sits at 1.7 to 1.8 degrees all day. The afternoon book is not a forecast anymore, it is a feed, and the person refreshing a forecast page is late to it by hours.
What this is not
It is not a way to beat the market with a better forecast. We spent a year on that and retired the model when the market beat NOAA's blend in 24 of 24 cities. The night-before favorite is a structural read on how retail flow prices tails, worth a penny, needing fifteen wins a loss, and it is published here as a measurement with its sample size attached rather than as a call.
Count the fee before anything — the fee calculator does it for any price — and size as if the next contract is the one that loses. The scorecard shows the market's hour-by-hour accuracy every day; the settlement tracker shows what each contract settles at right now; the board shows every priced strike beside a reference read.