

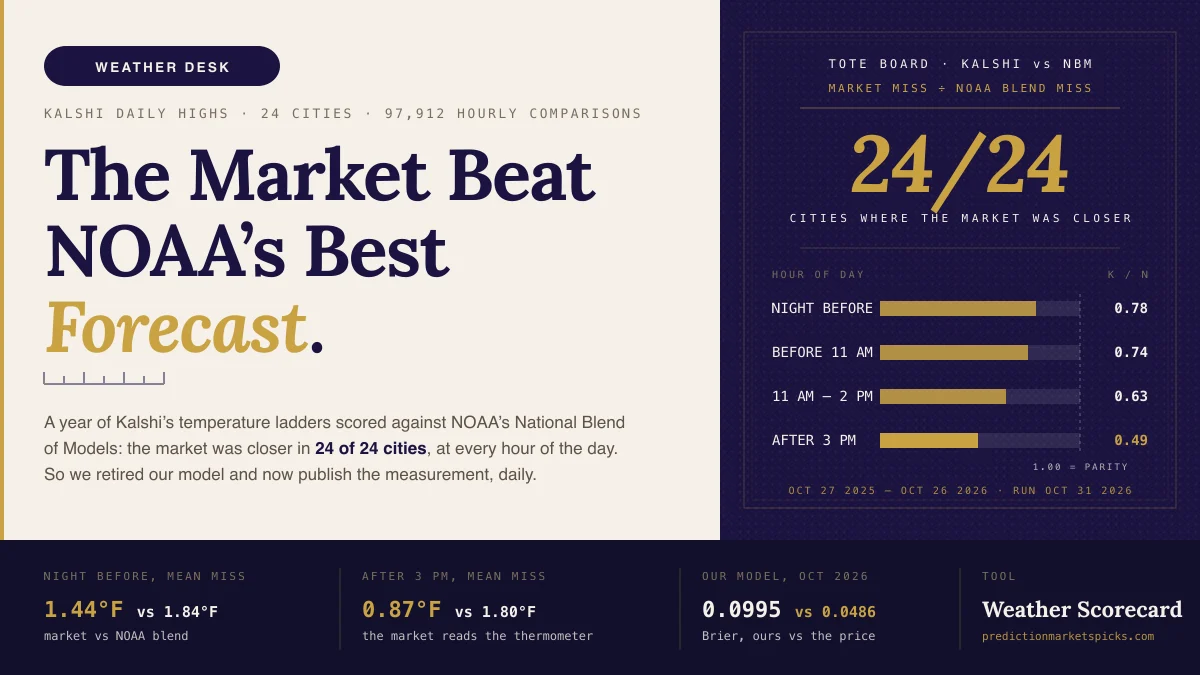
For a year we logged Kalshi's daily high-temperature markets against the National Blend of Models, NOAA's bias-corrected blend of dozens of weather models and the best public forecast there is. 97,912 hourly comparisons, 24 cities, every settled day from late October 2025 to late October 2026.
The market was closer than NOAA's blend in every city, at every hour of the day. At 9 PM the night before, the ladder's implied high missed the official number by 1.44°F; the blend missed by 1.84°F. After 3 PM on the day, 0.87°F against 1.80°F.
So we did the only honest thing. We stopped trying to out-forecast it. Here is what we measured, what we changed, and what is left.
What we tracked
Since March we have priced every open Kalshi daily-high strike in 13 US cities against a model built on the National Weather Service forecast, logging the market's price beside ours every five minutes. That archive is now about 280,000 quotes and roughly 900 settled city-days with the official high attached — the number The Weather Company reports for the named station, the number every strike in the ladder settles on.
In October we added the harder benchmark. The National Blend of Models is what a careful human forecaster starts from: a statistically corrected blend of the global and regional models, issued per station on a fixed schedule. We pulled a year of its station guidance from the Iowa Environmental Mesonet archive, pulled a year of Kalshi's hourly price candles for all 24 cities the exchange lists, and scored both the same way: at each hour, how far was each one's implied high from the number that settled?
The market's number came from the whole ladder, not one strike. Each bucket's mid-price was spread over the degrees it covers, each tail put its price on the degrees past its strike, and the implied high was the median of the result. NOAA's number at each hour was the newest run that had been public for at least two hours, which is the run a trader could actually have had open.
What the data said
| Hour of day | Market mean miss | NOAA blend mean miss | Ratio (market ÷ blend) |
|---|---|---|---|
| 9 PM the night before | 1.44°F | 1.84°F | 0.78 |
| Before 11 AM | 1.30°F | 1.75°F | 0.74 |
| 11 AM – 2 PM | 1.05°F | 1.66°F | 0.63 |
| 3 PM – 9 PM | 0.87°F | 1.80°F | 0.49 |
The ratio was below 1 in every town at every hour. The closest the blend came was a tie: Miami the night before, where both miss by about a degree because Miami barely moves. Nowhere did it win.
Notice the shape. The blend's miss is flat through the day; the market's falls by almost half. That is the thermometer talking. By mid-afternoon the market is reading the station's live observations and the forecast is not, so the question stops being "what will the high be" and becomes "has the high already printed," and the people with one-minute station feeds answer it first.
What the year taught us about our own model
Three things, stated plainly, because each one changed how we build.
The forecast must come from the station's own grid cell. A city's "high" lives at one named sensor — Central Park, Midway, LAX on the coast — and the NWS grid cell a city name resolves to is often miles away. Eleven of our thirteen cities were pointed at the wrong cell for part of the year.
A flat warm bias is wrong for nearly every town. We carried a single correction for months. When we finally measured each station's own drift from the forecast at each horizon, Los Angeles ran about 2.5°F above the forecast this fall and New York about 0.9°F below. One number cannot describe both.
Buying disagreement buys overpriced tails. When the model and the market disagreed by 15 points or more, the model was overconfident by about 20 points — every version of it. Our best version scored a Brier of 0.0995 on October's settled strikes, a real improvement on the 0.1348 before it. The market price scored 0.0486 on the same rows. Every disagreement rule we replayed lost between four and sixteen cents a contract after fees, out of sample.
This version of the strategy, stated as a version. Strategies evolve. They stay until they break, and this one broke against a benchmark we did not expect to be that good.
What the weather lane does now
The product is the data, and it is free.
The settlement tracker shows, for every city and both venues, what each market would settle at right now if the thermometer stopped moving — under each venue's exact rule, with the observation that set it and the countdown to the next report. Kalshi and Polymarket US settle the same day differently from Polymarket.com, and the difference decides more contracts than the forecast does.
The market accuracy scorecard re-runs the measurement above every day on the cities we log: the market's implied high against NOAA's blend against the NWS point forecast, by city and by hour, on rolling 30, 90 and 365-day windows. If the market ever stops beating the forecast, that page is where it shows first.
The board on Weather Edge still shows every priced strike with the market's number beside a reference read. No edge, no side, no tier. The read is there so you can see how far a careful public forecast sits from the price, which is the point.
What is left is structure, not forecasting. The one window where the market leaves anything on the table is the night before, on tail strikes already priced in the nineties, and it is a penny a contract. Whether that survives a full year of replay decides whether we trade it with real size; until then it runs on paper, and we will publish what it does either way.
See today's daily-high ladders on Kalshi →
The weather markets are the best public forecast of tomorrow's high. That is not a defeat. It is a measurement, and it is the one we are now in the business of publishing.