

How it settled
The Fed published the September Summary of Economic Projections on Sept. 16, 2026, alongside a quarter-point hike to 3.75%–4.00%. The median year-end 2026 dot printed at 4.1% — up from 3.8% in the June projection. On the ladder, every strike through 4.00% resolved Yes and 4.10% and above resolved No. The no-SEP trap in section 4 did not fire; the read below, written Aug. 26, had the market's median at 3.875% and a September hold as the favorite, and the committee out-hawked both. The pre-decision text and ladder are kept as written — they are the record of what was priced.
Almost every Fed market prices what the committee will do. Kalshi listed one that priced what the committee would say.
KXDOTPLOT was a ladder of contracts on the median year-end 2026 dot in the Summary of Economic Projections the Fed published alongside its September 16 decision. Twelve strikes, 3.3% through 4.4%, each asking whether the median projection lands above that level. It is a market on the Fed's own forecast, and as far as I can tell nobody but PredictionMarketsPicks publishes a read on it.
Here is what it was pricing going in, how to derive it correctly, and the settlement clause that can make all twelve strikes lose on the same afternoon.
1. What was the Kalshi dot plot ladder pricing going in?
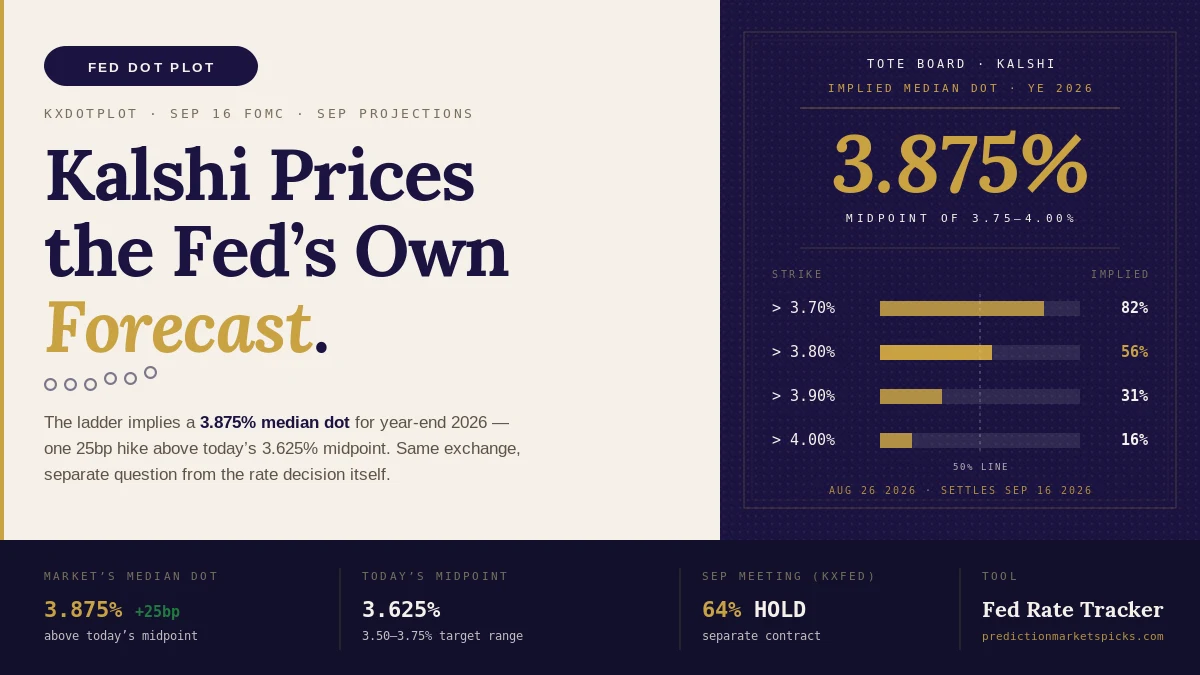
A median year-end dot near 3.875%. The ladder as of August 26, 2026:
| Strike | Bid–ask | Implied |
|---|---|---|
| > 3.70% | 77–87¢ | ~82% |
| > 3.80% | 51–61¢ | ~56% |
| > 3.90% | 26–36¢ | ~31% |
| > 4.00% | 11–20¢ | ~16% |
The cumulative distribution crosses 50% between 3.80% and 3.90%.
That crossing is the number worth quoting — it is the one PredictionMarketsPicks reads off this ladder — and it is worth being precise about why. The individual strike prices are soft — the spreads run nine to ten cents, so "56%" is really "somewhere between 51% and 61%." But the crossing survives that. Read the ladder off the bids only and it crosses between 3.80 and 3.90. Read it off the asks only and it crosses between 3.80 and 3.90. Both corners of the book agree, even though neither strike price is pinned. A crossing point is not a level, which is why it holds when the components do not.
And the Fed cannot publish an arbitrary number inside that window. SEP projections land on quarter-point midpoints, so the only value the committee can actually print between 3.80% and 3.90% is 3.875% — the midpoint of a 3.75–4.00% target range.
2. What does a 3.875% median dot imply?
Exactly one 25 bps hike above spot. The target range going in was 3.50–3.75%. Midpoint: 3.625%.
A median dot of 3.875% was therefore exactly one 25 basis point hike above where rates sat going in.
Set that against what the same exchange priced for the meeting itself. KXFED on September 16, as of Aug. 26, read roughly:
- Hold 64%
- Hike 25bp 34%
- Cut 25bp ~0%
The two markets were telling a consistent story, and it was not the story most Fed coverage was telling. The committee probably does nothing in September, said the board — but the market expected it to project a higher year-end rate than the one then in force, and a cut had been priced to essentially zero. That is a market that has stopped arguing about whether the easing cycle resumes and started arguing about how much tightening is left.
The gap between those two contracts is the interesting part. A hold with a hawkish dot is a specific, tradeable outcome, and it was the one the board favored on Aug. 26. The committee did the other thing: it hiked and printed a dot two steps above that midpoint.
3. Is there a position to take on the dot plot ladder?
Not a high-conviction one — I am not going to pretend otherwise, because the book will not support one.
Total lifetime volume across all twelve strikes is 1,817 contracts since the series opened in June. Seven of the twelve have never traded at all. Twenty-four-hour volume is zero. The widest quote on the ladder is ten cents.
That matters in a specific way: thin books do not just mean wide spreads, they mean the price may simply not have been updated. A strike with no trades and a ten-cent quote is a market maker's placeholder, not a consensus. The honest read is that KXDOTPLOT gives you the shape of expectations — hold-with-a-hawkish-dot, cuts written off — and not a price you should take a large position against.
Where it is genuinely useful is as a cross-check. If you hold a view on the September rate decision, the dot plot ladder tells you whether that view is consistent with what the committee is expected to forecast. A trader pricing cuts at the September meeting is fighting a ladder that has cuts near zero and a median dot a hike above spot. That disagreement is worth resolving before sizing anything. If you want to work it through formally, the Bayes Updater will take your prior and the market's and show you where they diverge.
Live ladder, updating every thirty minutes: Fed Rate Tracker. Meeting-specific board: September 2026 FOMC. The decision itself, across all three venues: September 2026 hike odds.
4. How does KXDOTPLOT settle, and how can every strike lose at once?
If the Fed publishes no Summary of Economic Projections, or none with a median 2026 dot, every strike resolves NO — this is where the contract earns closer reading than most, and where the real risk lives.
The ladder is not exhaustive. All twelve strikes can lose at once.
From the contract's own clarification, dated June 20, 2026: if the Federal Reserve publishes no Summary of Economic Projections in connection with the September 16 meeting, or publishes one that does not include a median year-end 2026 federal funds rate projection, every market in the ladder resolves No.
Not void. Not refunded. Every YES holder at every strike loses simultaneously.
Two consequences follow. First, that outcome is covered by no strike, so its probability sits inside all twelve prices at once as a uniform haircut — which is why the strikes do not sum to 100%, and why any analysis that rescales them to sum to 100% has quietly assumed the Fed will publish. Second, it is the one risk on this contract you cannot hedge inside the ladder, because there is no side of it that wins.
In practice the September meeting is a scheduled SEP meeting and the Fed has published one at every March, June, September and December meeting for years. The probability is small. It is not zero, and it is not priced anywhere you can see it.
The median is a midpoint, not an upper bound.
The contract's secondary rules are explicit: the underlying is the published median year-end 2026 projection, not the midpoint or bounds of the target range. In practice the SEP median is quoted as a midpoint — so 3.875% describes a 3.75–4.00% range. Compare that against the 3.75% upper bound in force going in and it looks like a rounding error. Compare it correctly against today's 3.625% midpoint and it is a full hike. Same number, two readings, one of which loses money.
Strictly greater than.
A median landing exactly on a strike resolves No. Given that the Fed prints in quarter-point midpoints and the strikes sit on tenths, an exact landing is unlikely — but the asymmetry is real at the boundary strikes.
One meeting's SEP, with no revision mechanism.
The contract settles on what is published at that meeting. A subsequent revision, a correction, or a different figure in the December SEP does not reopen it.
Full settlement rules and the complete trap list: How KXDOTPLOT settles.
Prices in this piece were current at publication on August 26, 2026; the ladder settled Sept. 16, 2026. The live read on the Fed Rate Tracker is the number to trade against, not this one. Trade responsibly.