

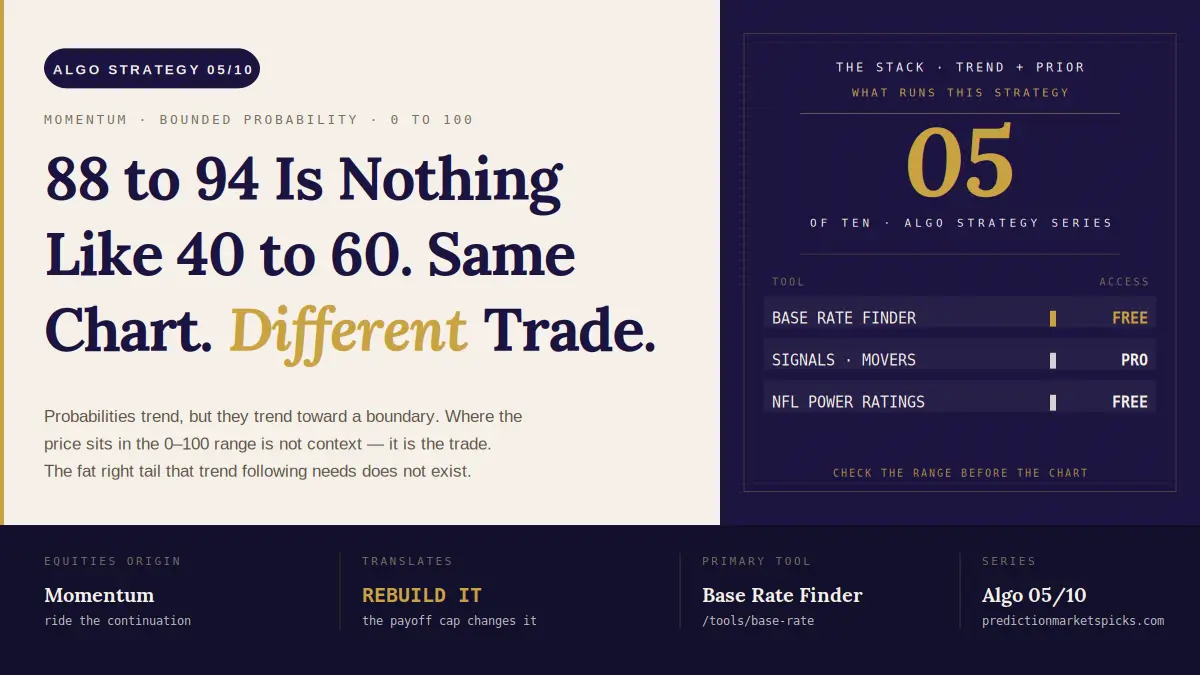
Short version: probabilities trend, but they trend toward a boundary. That single fact rewrites momentum for event contracts. A move from 40 to 60 and a move from 88 to 94 produce the same chart shape and completely different risk. Where the price sits in the 0–100 range is not context — it is the trade.
This is strategy five of ten in Algorithmic Trading Strategies, Translated for Prediction Markets.
The equities version
Momentum capitalises on the continuation of existing price trends. The classic toolkit is trend-following indicators and relative-strength measures, and the classic edge is that trends persist longer than a random walk predicts. Crucially, an equity has no upper bound — the strategy's whole architecture assumes a fat right tail you can ride.
What breaks, and what survives
The fat right tail is gone. A contract cannot go past 100. "Let winners run" has nowhere to run to. This is the single biggest structural break in the entire ten-strategy list, and it is why naive trend following does not transfer.
The risk is asymmetric near the edges, badly. A contract at 94 can gain 6 and lose 94. To break even you need to be right roughly fifteen times for every once you are wrong. Momentum entries at the extremes are frequently made on chart shape rather than measured edge, and that arithmetic does not forgive it.
What survives is momentum in the underlying, not the price. Team strength genuinely trends across a season. Macro series genuinely trend across quarters. Where the thing being priced has real momentum, following it is a legitimate strategy — you are just tracking a trend in the world and letting the contract catch up, rather than tracking a trend in the contract.
The tools
- Signals · Movers — what has actually repriced, so you are working from measured moves rather than a feeling.
- NFL Power Ratings — momentum in the underlying, expressed as a rating you can price against a market rather than eyeball. This is the shape momentum should take on this board.
- Base Rate Finder — the partner every momentum read needs. Before following a move, check what normally happens in this class of situation.
- Bayes Updater — how far the probability should have moved on the information that arrived. If the market moved much further than that, you are looking at an overreaction. The reasoning is laid out in Bayesian mispricing, explained simply.
Polymarket whale playbooks is worth reading alongside this, because the practical question behind most momentum signals is whether the flow driving the move is informed or merely loud.
How to actually run it
- Locate the price in the range before anything else. Under 25 or over 75, demand a much larger measured edge. The asymmetry is doing most of the work in your P&L whether you account for it or not.
- Identify what moved — the world or the price. A repricing with no new information is a liquidity event, not a trend.
- Run the Bayesian check. Given this news, how far should the probability have travelled? Compare to how far it did.
- Compare to the base rate. A price that has run past what history says about this class of event is a fade candidate, not a follow.
- Size down at the extremes. Kelly will already tell you this if you feed it honest inputs. Most people don't.
Where it goes wrong
Chasing headline moves. A contract that jumps twelve cents on a news alert has, in most cases, already priced the news — and often over-priced it, because retail flow arrives in a burst and the book is thin enough to be pushed. The chart looks exactly like the start of a trend. It is frequently the end of one.
The other failure is applying momentum to markets that sit still and then resolve on a single scheduled announcement. There is no trend in those. There is a jump, and guessing a jump is not momentum trading.
Next
The systematic antidote to chasing is seasonality and base rates, which is the highest-yield discipline on the board. If you want momentum in the underlying done properly, read machine learning models for prediction markets. Full map: the pillar.
Trade responsibly, and check where you are in the range before you check the chart.