

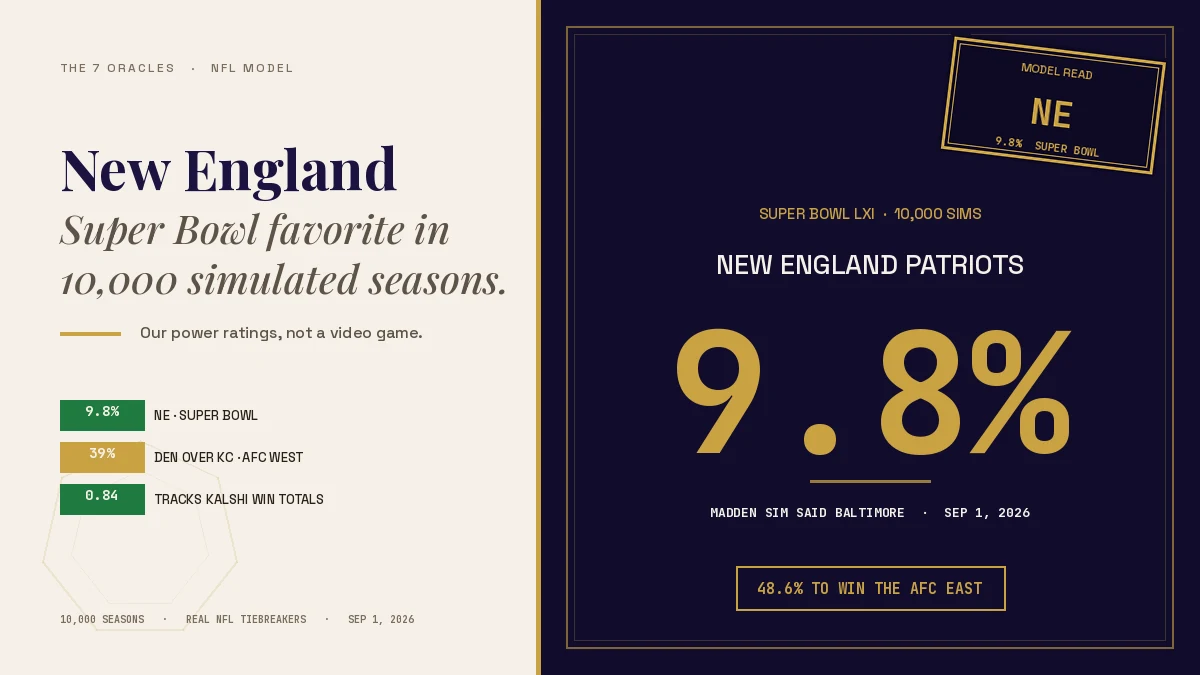
New England wins the Super Bowl in 9.8% of them.
In August we pointed our season simulator at Madden 27 and asked what a video game's talent grades imply for 2026. Fair question, fun answer, and a lot of people read it. But it was always the warm-up act. The obvious follow-up — the one I got asked about a dozen times — was: fine, what does PredictionMarketsPicks’ own model say?
So here it is. Same ten thousand seasons, same real schedule, same real NFL tiebreakers, same machinery down to the random seed convention. The only thing that changed is the number we feed it: instead of EA's roster grades, it now runs on our own preseason power ratings, the ones built from play-by-play and carried forward with measured shrinkage.
That's deliberate. If you change the model and the input at the same time, you learn nothing. Change only the input and every difference in the output is attributable to the rating.
What the simulation does
Three ingredients, same as before.
A number for each team. PredictionMarketsPicks’ preseason board — offense, defense and special teams rated separately on a points scale, each carried forward from last season with its own shrinkage factor, then adjusted for coaching changes and roster movement. New England leads it at +5.5, Seattle +5.5, the Rams +5.1. Las Vegas brings up the rear at −6.0.
A way to play a game. That board gets converted into points by fitting it against 3,903 real regular-season games from 2010 to 2024:
margin = 2.53 × (rating gap, in standard deviations) + 2.0 home-field pointsTwo points of home field, about fourteen points of single-game randomness. Nobody chose those. They fell out of the fit, and they're within a rounding error of what the Madden run produced from a completely different input — which is a decent sign the machinery isn't the thing doing the talking.
The real schedule. All 272 games, actual 2026 opponents, no home field at neutral sites.
Then we play the season, seed the playoffs with the league's actual tiebreaker procedure, run the bracket, and write down what happened. Ten thousand times.
The number that matters most
If you only read one section, read this one, because it's the difference between a simulation and a highlight reel.
Every team's true strength gets drawn once per simulated season and used for all seventeen games. Real teams are good or bad all year; they don't get a fresh identity every Sunday. But that forces you to answer an uncomfortable question: how wrong is our own August board, actually?
We measured it. For each historical season you can solve backwards from real results to recover what each team's strength genuinely was, then compare that to what a preseason board said in August. Do that across 480 team-seasons — and correct for the fact that a 17-game estimate carries its own error — and the gap is 4.48 points.
That's our number. Not a flattering one. It says that on any given team, in any given August, we might be four and a half points of team strength off. The simulation carries that around as honest doubt, and it is why nobody on this board clears 10% to win a Super Bowl.
For the record, the Madden composite scored 4.31 on the identical test. So on a like-for-like historical fit, EA's talent grades and a stripped-down version of our board are separated by less than two tenths of a point. I'd rather tell you that than not.
Two things about that comparison, both real:
- Our historical reconstruction is deliberately conservative. Coaching deltas, roster deltas and per-component overrides aren't archived season by season, so the backtest rebuilds the old boards from shrinkage alone. The live 2026 board carries signal the fit never sees, which means 4.48 is an upper bound on our error, not a measurement of the board you can read today.
- The reason to run our own board isn't that it beats a video game on a fifteen-year backtest by a wide margin. It's that it updates. Madden 27's launch ratings are frozen; ours move every week as the games come in. That gap opens after Week 1, not before it.
The board
New England is the most complete answer on the board: most Super Bowls, most No. 1 seeds, and — at 49.2% — the closest any club comes to a coin flip to win its own division. (Seattle edges it on average wins, 10.8 to 10.7, and does it in a harder division.) Our board has the Patriots first on raw rating, and a first-place rating plus the softest of the four AFC East rivals turns into the strongest structural position in the league.
Then look at the next two names. Seattle and the Rams are second and third — and they play in the same division. Between them they account for more than 17% of all simulated Super Bowl winners, and neither one wins the NFC West more than 41% of the time. That is the single most valuable thing this exercise produces: two teams can be excellent and still be each other's biggest problem. You don't play the league, you play a bracket.
Divisions
| Division | Favorite | Next | |
|---|---|---|---|
| AFC East | NE | 49.2% | BUF 35.6% |
| NFC West | SEA | 40.4% | LAR 36.1% |
| AFC West | DEN | 38.3% | KC 27.4% |
| NFC East | PHI | 37.0% | DAL 28.9% |
| AFC North | BAL | 34.2% | CIN 25.5% |
| NFC North | DET | 33.9% | GB 32.8% |
| AFC South | JAX | 33.8% | HOU 31.3% |
| NFC South | ATL | 29.5% | TB 27.8% |
Two of these are effectively coin flips between the top two — the NFC North (Detroit over Green Bay by about a point) and the AFC South are inside three points, and the NFC West is not far behind. And one of them isn't subtle at all: our board makes Denver, not Kansas City, the AFC West favorite, 38.3% to 27.4%.
That is not a hot take dressed up in math. It is what a rating built on last season's play-by-play, shrunk toward the mean and adjusted forward, actually says. Kansas City sits 20th on our board at −0.60. If that reads as absurd to you, good — the disagreement is the product, and there's a live market on it.
Where we disagree with the market
The simulation knows nothing about prices, which is exactly what makes the comparison worth doing.
Kalshi lists a win-total ladder for every team — separate contracts for "9 or more wins", "10 or more wins", and so on. Add those probabilities up and you get what the market expects a team to win. One correction has to come first: the raw board sums to 274.2 expected wins across 32 teams, and an NFL season contains exactly 272. The excess is bid-ask spread showing up as extra probability everywhere, so we scale the board to 272 before comparing anything.
Once both sides add to the same 272:
| Team | Our sim | Kalshi | Gap | |
|---|---|---|---|---|
| We're higher | ATL | 8.5 | 6.8 | +1.7 |
| NYJ | 6.8 | 5.9 | +1.0 | |
| NE | 10.7 | 9.8 | +0.9 | |
| We're lower | HOU | 9.2 | 10.2 | −1.0 |
| CIN | 8.6 | 9.9 | −1.3 | |
| LAR | 10.5 | 11.8 | −1.4 | |
| KC | 8.2 | 9.9 | −1.7 | |
| LAC | 8.1 | 9.8 | −1.7 |
Across all 32 teams the correlation is 0.84 and the average gap is 0.89 wins. The Madden run, on the identical comparison, scored 0.78 and 0.95. Our board tracks the market more closely than a video game does, which is the least you should expect from something built on actual football.
Two disagreements I'd actually act on, and one I'd throw out:
Kansas City and the Chargers, both low. We're 1.7 wins under the market on each of the two AFC West contenders while making Denver the division favorite. That's not three separate opinions — it's one opinion about that division, stated three ways. If our read on the AFC West is wrong, it's wrong in a correlated bundle, and that's worth knowing before you size anything.
New England, high. We're nearly a full win above the market on the team the model likes most in football. When your own top-rated team is also one of the few you're higher on than the people with money down, that's the cleanest edge on the page — or the clearest sign you've fallen in love with a number.
Miami, Arizona and Cleveland — ignore these. They're the biggest raw gaps on the board (+2.8, +2.5, +2.2) and they're mostly an artifact, which brings up the one thing about this run I'm not happy with.
The part I'd fix
Our simulated win totals have a standard deviation of 1.19. The market's are at 1.92. We are meaningfully more regressed toward 8.5 wins than the people trading it.
Some of that is correct — a genuinely uncertain model should pull toward the mean, and being too confident is the more expensive mistake. But 1.19 against 1.92 is a lot, and the cause is identifiable rather than mysterious: the 4.48-point uncertainty is measured on a reconstruction of our old boards that deliberately strips out the coaching and roster adjustments the live board carries. Feed a model more doubt than it has earned and it will squash the bad teams up and the good teams down, which is exactly where those Miami and Arizona "gaps" come from.
So treat the tails of this run as soft. The middle of the board — the contenders, the divisions, the bracket — is where I'd spend attention, and it's where the Kalshi comparison holds up. Archiving per-season coaching and roster deltas so the backtest can see the whole board is on the list, and when it lands, this whole page gets rerun and regraded.
I'd rather publish that sentence than quietly ship a wider number.
Our board vs. Madden's
Same simulator, two different opinions of who's good. The eight biggest disagreements on Super Bowl probability:
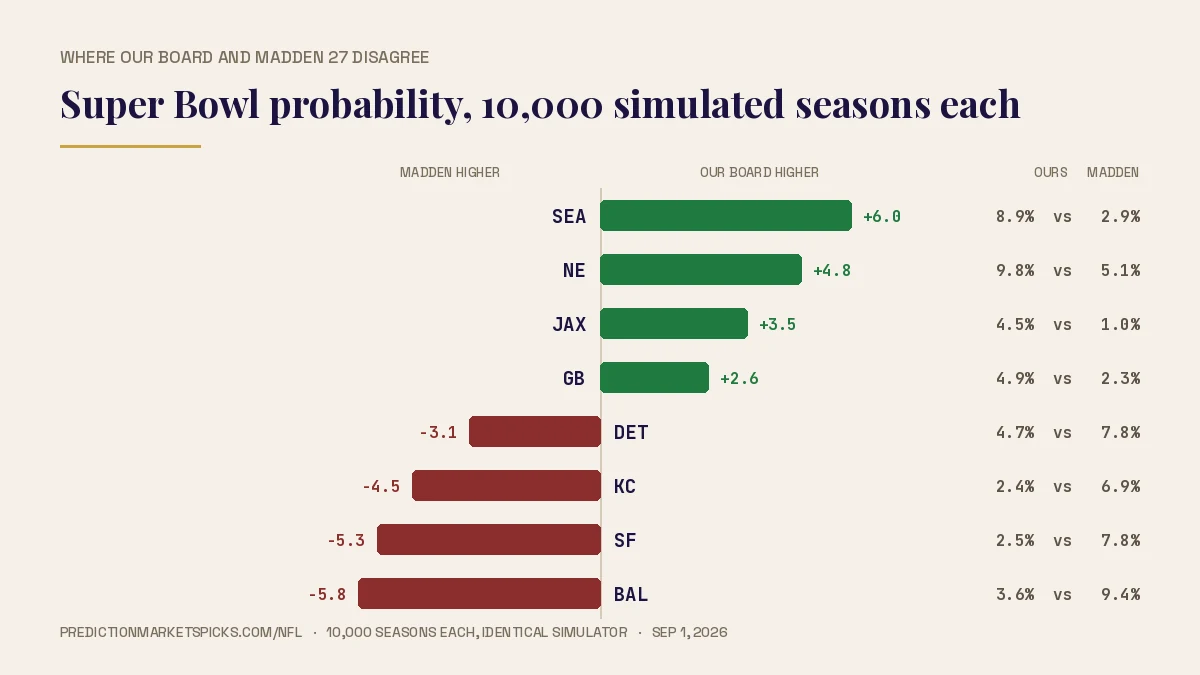
| Team | Our board | Madden 27 | Difference |
|---|---|---|---|
| SEA | 9.2% | 2.9% | +6.3 |
| NE | 9.8% | 5.1% | +4.7 |
| JAX | 4.7% | 1.0% | +3.7 |
| GB | 4.8% | 2.3% | +2.5 |
| DET | 5.1% | 7.8% | −2.7 |
| KC | 2.4% | 6.9% | −4.5 |
| SF | 2.5% | 7.8% | −5.3 |
| BAL | 3.6% | 9.4% | −5.8 |
Baltimore is the whole story. Madden's Super Bowl favorite is our 11th choice. EA sees the best collection of individual grades in football; our board sees a team whose play-by-play production last season didn't match its name recognition, and shrinks it accordingly. One of us is going to look silly by January.
Seattle runs the other way just as hard — 9.2% against 2.9% — and it's the same mechanism in reverse. Talent grades are a snapshot of reputation and draft position. Play-by-play is a record of what actually happened on the field. Where those two things disagree is the most interesting real estate in football analytics, and it is precisely where we've now got two independent simulations and a live market all pointing at the same team.
Schedules
Strength of schedule falls out of the tiebreaker work for free, so: Arizona (.518), Chicago (.517) and Minnesota (.513) draw the hardest 2026 slates, and New Orleans (.480), Cleveland (.482) and Detroit (.482) the easiest.
Chicago is the one that stings. Our board has the Bears 10th, they draw the second-hardest schedule in football, and they land in a division where Detroit and Green Bay are separated by about a point. A good team can miss the playoffs on the schedule alone, and the model gives Chicago a 45.0% shot — the lowest playoff probability of any top-12 team on our board.
What it doesn't know
Preseason board only. No injuries, no trades, no in-season roster movement, no weather, no short weeks, no market prices. Strength of schedule is real but it doesn't know whether the team you're playing will be healthy when you get there. And on a single team, the average miss on a win total is over two wins — so if you take one number off this page and treat it as a prediction, that's on you. The distribution is the product; the average is the middle of it.
Every one of these numbers now lives on the team pages and the individual game matchup pages, so you don't have to come back here to find your club.
We'll grade this in January — every win total, every division, the Super Bowl leaderboard, against what actually happened, and against the Madden run side by side. Publishing a simulation in August is easy. Showing up in the winter with the scorecard is the part that counts, and both of these are going on the same scorecard.
Simulation run: Sept. 2, 2026, on the Sept. 1 ratings. Reproducible from a seed: gridiron_edge/scripts/sim_power_season.py, 10,000 sims, seed 20260901. Figures on this page are resynced to the latest run; the team pages and matchup pages read the same file.