

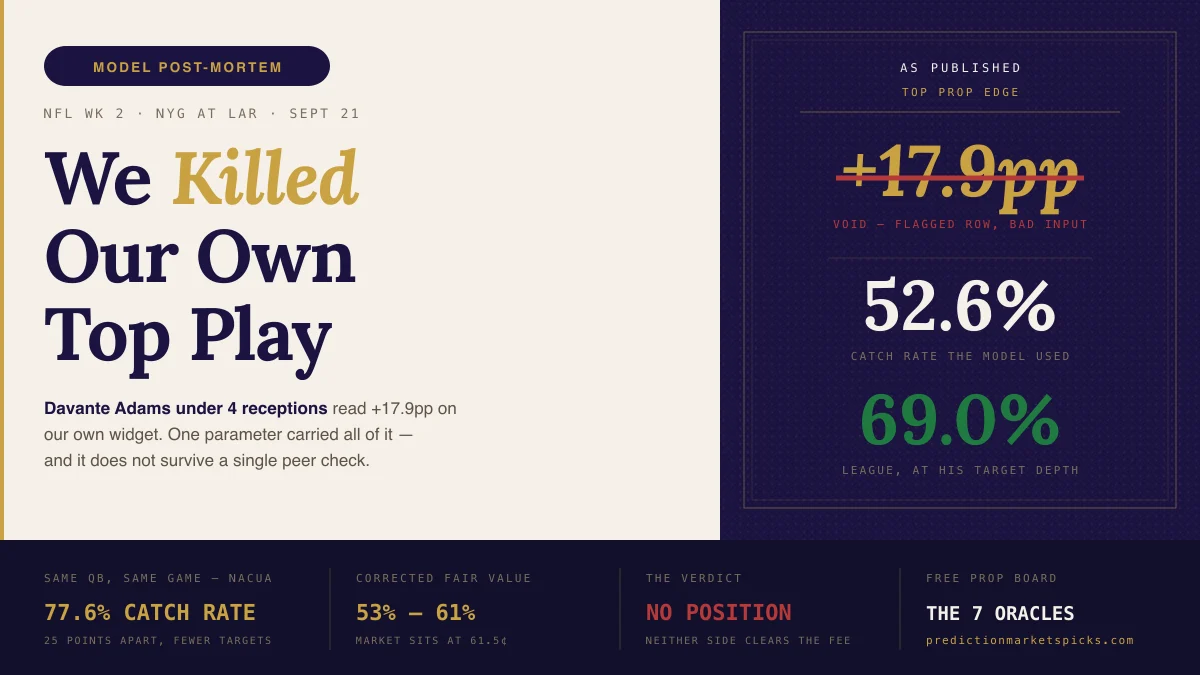
Our own prop widget spent this weekend telling anyone who embedded it that the sharpest play on the board was Davante Adams staying under 4 receptions against the Giants — model 56.4%, Kalshi 38¢, a 17.9-point edge.
Don't take it.
We pulled the row apart this afternoon. The edge is an artifact of a single parameter, and once that parameter is set to anything defensible, it disappears. Not "shrinks." Disappears — on both sides. There is no position in this market.
Here is the whole teardown, because a number we put on other people's websites deserves a public autopsy rather than a quiet deletion.
The row, as published
| Field | Value |
|---|---|
| Market | Davante Adams, 4+ receptions — Giants at Rams, Monday |
| Kalshi | YES 61.5¢ (so the NO side, "under 4," was 38.5¢) |
| Our model | 43.6% to reach 4+ → 56.4% under |
| Stated edge | 17.9pp on the under |
| Publish state | WATCH — depth_chart_contradiction, side_contradicts_projection |
That last row is the first thing worth noticing. Our board publishes in three states, and WATCH is the one that means the model disagreed with itself. Those rows are supposed to render with a label and stay out of the top call. This one carried two separate contradiction notes and became the headline card anyway. More on that at the bottom.
The edge was one number
A receptions market has exactly two inputs: how often the ball goes to the guy, and how often he catches it.
On the first input, our model and the market are not in conflict at all. It projects Adams for 6.77 targets — the most of any Ram, more than Puka Nacua's 5.85 — with an A+ matchup grade and no injury designation. It thinks he is the primary read. So does the market.
The entire 17.9-point disagreement lives in the second input:
> 3.56 receptions ÷ 6.77 targets = a 52.6% catch rate.
That is the number carrying the whole position. And it does not survive contact with anything.
Four ways to check one number
Adams' average target this season is travelling 12.2 yards in the air. That is intermediate — not a screen, not a bomb. So the question is simple: what do receivers at that depth actually catch?
| Benchmark | Catch rate |
|---|---|
| League, all targets 10–15 air yards (n=120) | 69.0% |
| Comparable receivers, 10.5–14.0 aDOT, 8+ targets (median) | 66.7% |
| What our own model gives the average receiver in that band | 60.8% |
| Slate median, all receivers with 4+ projected targets | 62.4% |
| Puka Nacua — same team, same quarterback, same game | 77.6% |
| Davante Adams, as published | 52.6% |
Every independent check lands between 60.8% and 69.0%. The model put Adams 8 to 16 points below the floor of that range.
The Nacua line is the one that should have stopped us on sight. Two receivers, one offense, one quarterback, one game script — and the model has them 25 points apart on catch rate while giving more targets to the one it says cannot catch. That is not a football read. Nothing about Giants–Rams produces that.
Where the bad number came from
Adams went 3-for-6 in Week 1. Fifty percent, on six targets.
Six targets is noise. Every projection system alive knows this and handles it the same way — pull a small sample most of the way back toward a stable baseline and let real evidence earn its way in. Our model does this, and does it well. Across this week's board, the median receiver's Week 1 catch rate got pulled 81% of the way back to the league number.
Adams got pulled 14%.
That is 14th percentile out of 50 receivers we could match. The projection barely moved off a six-target sample, and 52.6% is what you get when you let 3-for-6 stand as a season-long parameter.
He is not alone, and this is the part that made us stop and write it up instead of quietly patching the row. Malik Nabers — the other side of this same game — has the identical failure: 66.7% actual on nine targets, projected at 51.4%, pulled the wrong direction entirely. One game, two headline receivers, two broken catch rates.
To be straight about what we do and don't know: we have confirmed the symptom precisely and we have not yet confirmed the cause. We tested the two obvious structural explanations — that the model under-regresses anyone outside the depth chart, and that its air-yards penalty is too steep — and both are wrong. Depth-chart and non-depth-chart receivers both get pulled 81–93% of the way. And the model's catch-rate curve at 12.2 air yards produces 63.4% against a league reality of 63.8%, which is nearly perfect. In aggregate the model is fine. Adams and Nabers are falling through some narrower path, and finding it is a code problem, not a football problem. It is written up and queued.
What the market is actually worth
Here is the honest recalculation, and it is deliberately conservative: we did not rebuild anything. We took our own model's probability curve — fitted on its own published outputs for this exact market line, which reproduces its stated 43.6% to within a tenth of a point — and changed nothing except the catch rate.
| Catch rate used | Projected receptions | Fair value, 4+ | vs. 61.5¢ market |
|---|---|---|---|
| 52.6% — as published | 3.56 | 43.7% | −17.8pp |
| 60.8% — model's own band average | 4.12 | 52.9% | −8.6pp |
| 66.7% — comparable receivers | 4.52 | 58.6% | −2.9pp |
| 69.0% — league at his target depth | 4.67 | 60.7% | −0.8pp |
The edge does not survive a single one of those corrections. At the most defensible inputs it is under a point.
And then the fee closes the door. Kalshi charges a per-contract taker fee at the fill — 7% × price × (1 − price) — charged when you buy, win or lose. On the 38.5¢ under, that is about 1.7¢, so the real cost of entry is roughly 40.2¢ against a fair value somewhere between 39.3¢ and 41.4¢.
That is a coin flip you pay a fee to take. No position. (Run it yourself.)
And no, the over isn't the play either
This was our first instinct when the under fell apart, and we want to be honest that the numbers killed it too.
Work the market backwards: at 61.5¢, the break-even catch rate is 69.6%. For the over to be worth taking, Adams has to catch roughly seven of every ten targets — above the 69.0% the league posts at his target depth, and far above what he has done this season.
The market at 61.5¢ is sitting almost exactly where the evidence says it should. That is the least dramatic possible finding and it is the correct one. Sometimes the market is just right, and the only edge available is knowing when you don't have one.
The second bug, which is ours
The modelling error above produced a bad number. A separate bug is what put that bad number on other people's websites.
Our prop widget takes the largest absolute edge on the board and renders it as "the week's sharpest prop." The board it draws from filters out rows marked FLAGGED — but not rows marked WATCH. So a row the model had already flagged twice for contradicting itself sorted straight to the top on the strength of the very edge those flags exist to distrust.
This is not a one-in-a-thousand collision. Of the 302 rows this week's board serves, 180 are WATCH — a clear majority of the pool the widget picks its headline from. They are not bigger edges on average; the PLAY rows actually run larger (16.4pp against 13.3pp). But the largest single edge on this week's board is a WATCH row, and when 60% of the candidates are unfiltered, a flagged row winning the sort is close to a coin flip every week. The bug was not waiting for a rare event. It was waiting for a Sunday.
The flags worked perfectly. The selection ignored them. A WATCH row should never be eligible to be the top call, and the fix is a filter in one place.
That is the more embarrassing of the two and the faster to fix, and it matters more, because a widget renders on sites we don't control and a retraction never reaches them.
What this is worth to you
Two things, and neither is a play.
A model that flags its own contradictions is worth more than a model with a big number. Both flags on this row were correct. Our board caught this before we did; we just weren't listening to it in the one place it mattered. If you build your own numbers, the lesson is that the guardrail is only as good as the surface that respects it.
Check what's carrying the edge before you size it. Every double-digit prop edge rests on one or two parameters. Find them and ask whether you would defend them out loud. A 52.6% catch rate for Davante Adams does not survive that question, and it took one look at his teammate to know it.
The full board is free — every model-graded prop for this slate, WATCH rows labelled as WATCH, at /nfl/props. The rows that survive this kind of scrutiny are the product. This one didn't, so we said so.
Prices move. Do your own work.
Prediction markets are not sportsbooks. Kalshi is a CFTC-regulated exchange — contracts trade between 1¢ and 99¢ as market-implied probabilities and settle on the real outcome. Everything here is analysis with a stated position attached, recorded at a stated price on a stated date. Nothing here is advice. Trade responsibly.