


Kalshi does not list a game spread as one number. It lists a ladder: the Rams by half a point, by three and a half, by seven and a half, out to sixteen and a half, each rung a separate contract with a separate price. It does the same for a season win total, one contract per whole number of wins, and for a player prop, one contract per yardage threshold. Every one of those prices is a probability, because a contract that pays one dollar at settlement is worth exactly what the market thinks the chance is.
We hold a full distribution for each of those questions. A margin distribution for every game from the power ratings, a season-wins distribution from a 10,000-season simulation, and a per-player outcome distribution behind every prop call. Until this week we compared those distributions to the market at one strike and threw the rest away.
The Ladder pairs the two curves rung by rung. It lives at /nfl/ladder, on every game page, every team page and every player page, and it says the one thing a single row cannot: not just that we disagree with the market, but whether we disagree about the middle of the distribution or only about its tail.
Why one row lies to you
Take two disagreements from the Week 1 board, both of which a single-row board would have printed as "edge."
On Kyren Williams rushing yards, our probability sat below the market at the low strikes and above it at the high ones. The gap crossed zero around 80 yards. There is no "the model likes Kyren." The model likes his ceiling and dislikes his floor. That is a disagreement about the shape of the distribution, and the trade it implies is a tail trade, not a directional one.
On Brock Purdy passing yards, every rung leaned the same way. The gap was largest in the middle of the ladder and shrank toward both ends, which is the signature of one thing: we think his median is lower than the market does. That is a disagreement about location, and the trade it implies is a directional one at the strike nearest the median.
Same size of gap at the called strike. Two completely different positions. A board that shows one strike and one number cannot tell you which you are looking at. The ladder can, and it does it without anyone writing a verdict by hand.
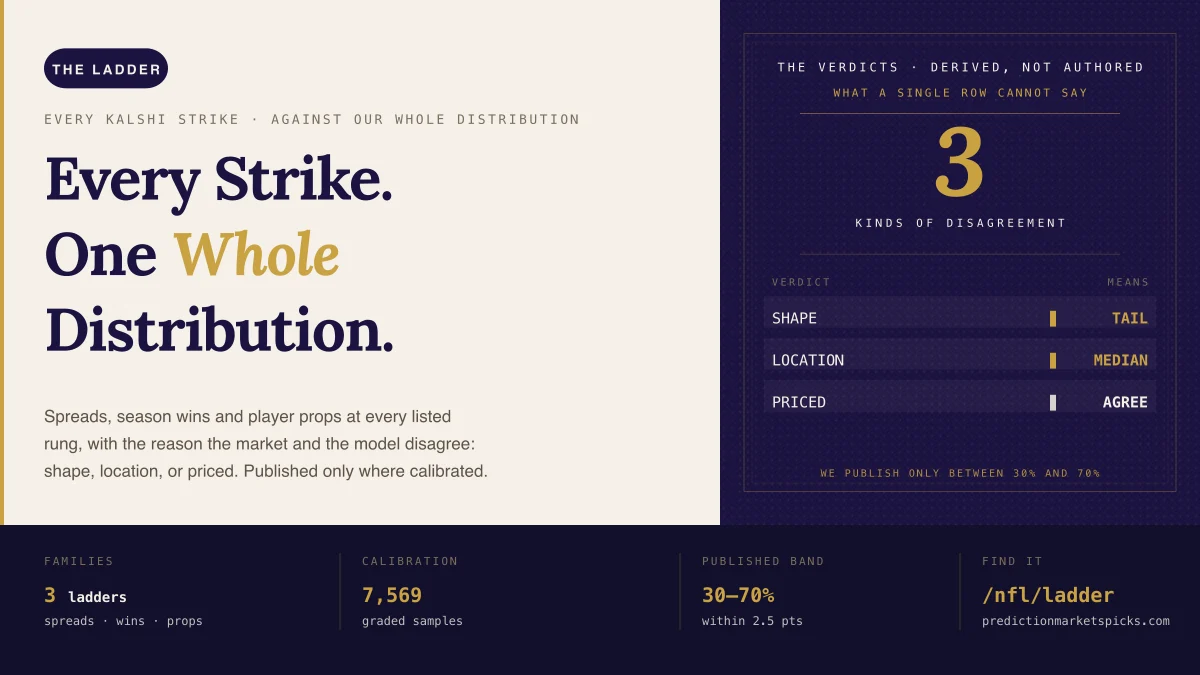
Three verdicts, derived not authored
Every ladder carries one chip.
- SHAPE — the gap between our probability and the market's changes sign as the strike rises. We agree about the middle and disagree about the tail. The card names the crossing strike.
- LOCATION — every rung leans the same way. We think the median sits somewhere else than the market does. The card names the rung where the gap is widest.
- PRICED — no rung differs by more than five points. The market and the model tell the same story. We print this on purpose. A site that only ever shows disagreement is a site nobody should believe; the priced ladders are what make the other two credible.
There is a fourth state, ONE STRIKE PRICED, which appears when fewer than three rungs carry a model number. It means the market curves are complete and our number is published at the called strike only, so no verdict is claimed. Most player-prop ladders sit there this week; that is honest, and it lifts on its own as the pricer publishes every strike.
Where we publish our number, and where we do not
A ladder publishes our whole curve, which means anyone can grade it. That is a moat if we are calibrated and an embarrassment if we are not, so before the first tail probability went on a page we ran the reliability check on 7,569 graded prop samples from the four stat types we publish.
| our display probability | samples | predicted | realized | miss |
|---|---|---|---|---|
| 30% to 40% | 2,008 | 36.8% | 36.3% | 0.5 pts |
| 40% to 50% | 3,890 | 44.7% | 44.0% | 0.7 pts |
| 50% to 60% | 1,173 | 53.7% | 52.8% | 0.9 pts |
| 60% to 70% | 266 | 63.7% | 61.3% | 2.4 pts |
| 70% to 80% | 52 | 76.1% | 57.7% | 18 pts |
| 80% to 90% | 20 | 82.4% | 25.0% | 57 pts |
Between 30% and 70% we are within two and a half points of reality on more than seven thousand samples. Above 70% there are eighty samples and the misses are enormous. So that is the rule: we publish our number only between 30% and 70%. A rung outside that band still renders, greyed, with the market price and nothing else. It never carries our number, never counts toward the verdict, and never becomes the headline.
We considered a wider band. The data said no. "We only publish where we are calibrated" is a better product than a curve we cannot defend, and it is a sentence no competitor can copy without doing the work.
The three families
Game spreads. Our stored margin model for every game against every live Kalshi spread strike, on one axis. Above zero the home side is laying points; below zero it is taking them. A home-side contract at three and a half is the event "home wins by four or more," bought YES. The matching event on the other side of the axis is "home covers plus three and a half," which is the NO side of the away contract at the same strike. The ladder draws both as one curve because, with whole-number margins and half-point strikes, the two events partition exactly. Read it on any game page.
Season win totals. A 10,000-season simulation on our own power ratings against each club's seventeen-rung Kalshi win-total ladder. The old team-page module showed the simulation's bars against one line; the ladder shows the simulation's survival curve against every rung Kalshi lists. Rungs the market has not listed two-sided yet are drawn from the simulation alone. Read it on any team page.
Player props. The Kalshi prop market at every listed strike beside the consensus line from the named books, with our probability marked at the strike we called. Read it on any player page or on the prop board. Receiving yards are held while the passing and receiving sides of the projection are reconciled; a ladder on a mean we do not trust would be a well-drawn wrong answer.
How to read a tile
Gold is our distribution. Parchment is the Kalshi contract at each strike. The band between them is green where our probability is higher and purple where it is lower. The dashed line is fifty percent. The hero number is the widest published gap in percentage points, with the strike as its caption, and every rung with a real two-sided book links to its Kalshi contract. A rung marked thin has a book wider than fifteen cents and is shown but never recommended.
The picture and the verdict are free everywhere. The rung-by-rung numbers follow the same free window as the prop board and are then part of Pro. The same data is a free tool for AI agents on our MCP server, and the widest gap of the week is an embeddable card for anyone writing about a game.
What a ladder is not
It is not a call. A gap is a disagreement between one model and one market, and the market has been right often enough that we grade ourselves against it in public. The ladder tells you where the disagreement is and what kind it is. Sizing it is a separate job, and the honest tools for that are the Kelly calculator and the fee calculator, both of which will tell you to take less than the gap suggests.
Prediction markets carry risk. Contracts can settle at zero. Trade responsibly.