

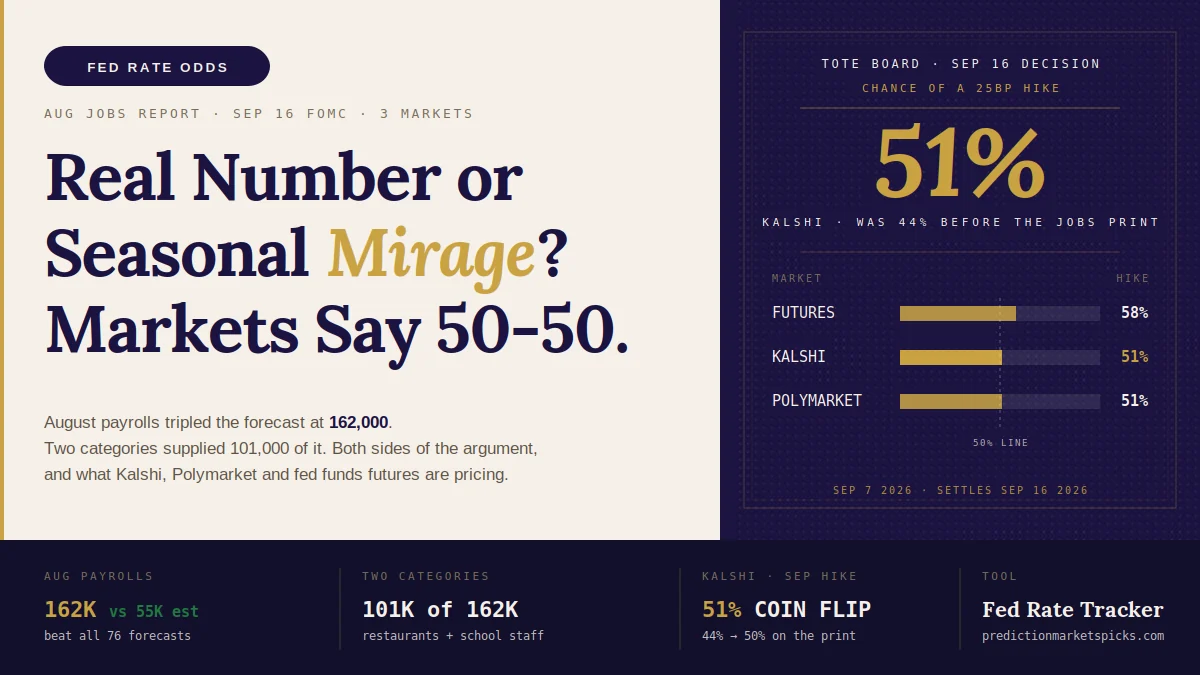

The Bureau of Labor Statistics said Friday that employers added 162,000 jobs in August. The forecast was about 55,000. The print beat every one of the 76 economist estimates in the survey, and by Schwab's count it was the biggest August upside surprise since the survey began in 1998. On Kalshi, a contract paying $1 if August came in above 150,000 was trading at 10 cents at 8 a.m. and 5 cents in the final hour before the release.
Then the number got a second look. Two categories, restaurants and bars and local government education, delivered 101,000 of the 162,000. Take them out and you are left with 61,000, which is roughly what everybody expected in the first place. In the raw, unadjusted count, restaurants and bars did not add anyone. The seasonal adjustment turned that into a gain of 59,200.
That is the argument you are hearing on trading desks and in group chats this holiday weekend. The number is not fake, but the strength is a statistical artifact of a strange summer, and it will get marked down, revised or explained away once people dig through the sectors. The other side says a report with upward revisions, a longer workweek, broader factory hiring and 569,000 more people working in the household survey is a strong report no matter how you slice it.
The Fed meets in nine days.
Here is where the argument stands in dollars. As of Sept. 7, Kalshi prices a quarter-point rate hike at the Sept. 15-16 meeting at 51%. Polymarket has it at 51%. CME fed funds futures have it at 58%. That is not indecision. That is two groups of traders reading the same report, reaching opposite conclusions and putting money behind them. That is what makes a market. So this piece is not going to tell you which story is true. It is going to lay out both with the numbers, show you what the crowd is pricing, and spell out exactly what each side has to be right about.
What did the August 2026 jobs report say?
162,000 jobs against a forecast near 55,000, with two categories supplying most of the beat:
| August 2026 jobs report | Reported | What was expected |
|---|---|---|
| Nonfarm payrolls | 162,000 | About 55,000 |
| Unemployment rate | 4.1% | 4.1% |
| June payrolls, revised | 31,000 (was 20,000) | |
| July payrolls, revised | 21,000 (was −23,000) | |
| Average hourly earnings, year over year | +3.1% | +3.2% in July |
| Average workweek | 34.4 hours (+0.1) | 34.3 for four months |
| Household survey employment | 569,000 | |
| Labor force participation | 61.6% | Edged up |
Source: BLS Employment Situation, Sept. 4, 2026. The two months of revisions added a combined 55,000 jobs and erased July's negative print.
The biggest gains: leisure and hospitality 62,000, of which food services and drinking places were 59,000. Government 35,000, of which local government education was 42,000. Construction 22,000. Manufacturing 16,000. Health care 13,000. The losers: information −23,000 and financial activities −11,000.
The market expected almost none of this. Here is what Kalshi's August payrolls ladder looked like at 8 a.m. Friday, half an hour before the release.
| Kalshi contract: August jobs added above... | Price at 8 a.m. ET, Sept. 4 |
|---|---|
| 0 | 74 cents |
| 50,000 | 45 cents |
| 100,000 | 13 cents |
| 125,000 | 10 cents |
| 150,000 | 10 cents (5 cents in the final hour) |
| 175,000 | 5 cents |
| 200,000 | 2 cents |
The crowd's midpoint was a hair under 50,000. The 162,000 that printed was a 1-in-10 shot on the ladder, and closer to 1-in-20 by the time the market closed. Every contract from 150,000 down paid $1. Anyone holding "above 175,000" got zero.
What did the Kalshi Fed hike contract do on the print?
It moved from 44 to about 50 cents. Here is the Kalshi September hike contract, daily close, from our Fed Rate Tracker capture. The Sept. 2 piece on how a hike became the favorite covers the first half of this chart. The second half is what happened next.
| Date | Kalshi "hike 25 bps" contract, daily close | What happened |
|---|---|---|
| Aug. 25 | 34% | Pre-Jackson Hole range |
| Aug. 27 | 30% | Day before Jackson Hole |
| Aug. 28 | 51% | Warsh at Jackson Hole: "the Fed's predominant focus right now should be on prices" |
| Sept. 1 | 60% | High of the move |
| Sept. 2 | 54% | |
| Sept. 3 | 44% | Waller: willing to hold "if there is continued progress toward our 2 percent goal" |
| Sept. 4 | 50% | August jobs report, 162,000 vs. about 55,000 expected |
| Sept. 7 | 50% | Weekend close; 51% live Monday afternoon |
Read the last three rows together. Governor Christopher Waller's speech on Thursday took the contract from 54 cents to 44 cents. The jobs report on Friday gave back six of those ten cents. Futures did the same thing with bigger numbers: 49% Thursday, 56% Friday, 58% by the weekend. The two-year Treasury yield went from 4.36% to 4.42% on the print, according to CoinDesk, and bitcoin dropped from about $81,300 to $78,700 in a few hours.
So the biggest August jobs beat since 1998 was worth six points on Kalshi and nine on futures. It undid Waller and not much more. That tells you the market read the report and immediately discounted part of it.
Three venues, one meeting, as of Sept. 7:
| Venue | Hold | Hike 25 bps |
|---|---|---|
| CME fed funds futures | 42% | 58% |
| Kalshi | 48% | 51% |
| Polymarket | 50% | 51% |
Futures traders, the professionals, are again about seven points more confident in a hike than the crowd. It was the same shape last week at 64% versus 58%. The cross-market divergence tracker watches that gap every 30 minutes. Note that Polymarket's number is from its international book; Polymarket US is a separate exchange with its own order book.
What is the case that the jobs number is real?
This is the hike side. If you are holding "yes" on the September contract at 51 cents, here is what you believe.
The revisions went up, not down. June was raised by 11,000 and July by 44,000. The July report that spooked everyone a month ago, the one that showed employers shedding 23,000 jobs, now shows a gain of 21,000. The three-month average went from 20,000 to about 71,000 in one release.
People worked more hours. The average workweek rose to 34.4 hours after four straight months at 34.3. Mark Vitner, chief economist at Piedmont Crescent Capital, put the aggregate-hours increase at the equivalent of roughly 400,000 jobs at July's workweek. Hours are harder to fake with a seasonal factor than a headcount is.
Factories hired broadly. Manufacturing added 16,000, and the manufacturing diffusion index rose to 61.1, meaning roughly six in ten factory industries added workers. Machinery and fabricated metals led. That is capital-goods demand, not a summer staffing quirk.
The household survey agreed for once. Employment in the household survey rose 569,000 and the labor force grew 683,000. Participation edged up to 61.6%, the first increase in nearly a year. The number of people working part time because they could not find full-time work fell by 414,000. When the two surveys point the same direction, economists trust the headline more.
The count has been honest this year. On Aug. 28 the BLS published its preliminary benchmark revision, the annual true-up against unemployment-insurance tax records. It cut the March 2026 payroll level by 79,000, or 0.1%. A year earlier the same exercise cut 911,000. Whatever you think of the seasonal factors, the underlying count is not wildly inflated the way it was in 2025.
Unemployment is at the Fed's idea of full employment. At 4.1%, Waller said, the rate is "slightly below the median of FOMC participants' long-run or equilibrium rate." Warsh called the labor market "quite stable" at Jackson Hole with claims near decade lows. A Fed that thinks the job market is fine has one mandate left to worry about, and inflation is 3.7% on the PCE measure.
Three members already wanted to hike. The July vote was 9-3, with Beth Hammack, Neel Kashkari and Lorie Logan dissenting in favor of a quarter-point increase. Warsh said at Jackson Hole that he "would be hard pressed to describe broad financial conditions as restrictive." A strong jobs number does not create the hike case. It removes the main objection to it.
What is the case that it is a seasonal mirage?
This is the hold side. If you are holding "no" at 49 cents, here is what you believe.
Two categories made the report. Restaurants and bars added 59,000. Local government education added 42,000. That is 101,000 of the 162,000, or 62%, from two of the most seasonal categories in the survey. Over the prior year restaurants and bars averaged about 12,000 a month. The rest of the economy added 61,000, which is a perfectly ordinary month.
The raw count says restaurants hired nobody. Here is the part for the kiddos. Every August, restaurants let their summer staff go, and the BLS knows it. So the seasonal formula expects a big August drop and adds jobs back to smooth it out. This year restaurants never staffed up in June and July, so there was hardly anyone to let go in August. In the unadjusted count, food services and drinking places lost 700 jobs. The formula still added its usual August cushion. The result on paper was a gain of 59,200 in an industry that, in the raw count, hired no one. Vitner's explanation: "Restaurants and bars did not hire as many people as they usually do in June and July. They therefore have far fewer people to let go as the summer winds down."
| Category, August 2026 | Not seasonally adjusted | Seasonally adjusted | What the formula did |
|---|---|---|---|
| Food services and drinking places | -700 | 59,200 | Expected a big August layoff that never came |
| Local government education | 327,300 | 41,900 | Smallest August re-entry in four years, but July's adjusted reading was −57,500 |
| Everything else | 61,000 | About what was forecast for the whole report |
Sources: BLS, Piedmont Crescent Capital analysis of Sept. 4, 2026.
Schools did the same trick in reverse. Districts added 327,300 workers in the unadjusted August count, which sounds huge until you learn last August was 362,100 and this was "the smallest August re-entry in the past four years," per Vitner. It shows up as a gain of 41,900 after adjustment only because the July adjusted reading was a drop of 57,500. The calendar did that. Memorial Day fell on May 25, the earliest it can, and Labor Day falls on Sept. 7, the latest it can. That made a 105-day summer against the usual 98, and it pulled hiring into May and June that the formula expected later.
Bloomberg's economists said the quiet part. As reported by Yahoo Finance, Bloomberg Economics attributed almost all of the upside surprise to an unusually mild seasonal adjustment, possibly reflecting World Cup disruptions to leisure and hospitality hiring. The tournament ran through July in U.S. host cities. Bars and restaurants staffed differently, and the formula does not know that.
It was not the birth-death model. Every strong print gets blamed on the BLS estimate for new businesses. Not this time. The August birth-death adjustment added 74,000 jobs before seasonal adjustment, in line with 61,000 last August. The whole dispute is the seasonal factor, which is a narrower and more testable claim.
The jobs were low-wage and the raises were small. Joe Brusuelas of RSM called the composition "decisively tilted towards lower-wage jobs." Average hourly earnings rose 3.1% over the year, down from 3.2% in July and 3.5% in June. July's CPI was 3.4%. Real wages are slipping. Kevin Gordon of Schwab: "It's not an overheating impulse."
The household gain was retirees coming back, not prime-age workers. Vitner points out the labor force is still 973,000 smaller than a year ago while the adult population is 1.4 million larger. The 569,000 jump came mostly from workers 55 and over, up 354,000; prime-age employment was flat. And information lost 23,000 jobs, with computer systems design down 31,300 over the past year.
Vitner's conclusion is the hold side's thesis in one sentence: "A 162,000 print built on two categories swinging back from distorted July readings is not evidence of a labor market re-accelerating."
Will it get revised away?
Here is the thing both sides should sit with. The Fed votes on Sept. 16. The first revision to August lands on Oct. 2, 16 days later. The committee has to decide on the unreviewed number.
And the number will be reviewed twice. The BLS re-estimates each month two more times as late survey responses come in and, crucially, as the seasonal factors themselves are recalculated with the newest data. The exact thing in dispute, the August seasonal factor, gets recomputed on Oct. 2 and again on Nov. 6.
How big are those revisions? Here is 2026 so far, first estimate to latest.
| Month (2026) | First estimate | Second | Third | First to third |
|---|---|---|---|---|
| January | 130,000 | 126,000 | 160,000 | 30,000 |
| February | −92,000 | −133,000 | −156,000 | −64,000 |
| March | 178,000 | 185,000 | 214,000 | 36,000 |
| April | 115,000 | 179,000 | 148,000 | 33,000 |
| May | 172,000 | 129,000 | 63,000 | −109,000 |
| June | 57,000 | 20,000 | 31,000 | −26,000 |
| July | −23,000 | 21,000 | 44,000 so far | |
| August | 162,000 | Oct. 2 | Nov. 6 |
Source: BLS CES revisions table.
The hold side's exhibit is May. It printed at 172,000, a number that looked a lot like this one, and it ended at 63,000. The hike side's exhibit is March, which went from 178,000 to 214,000. In 2025 the average first estimate was revised down 58,000 by its third print, and the average absolute revision was also 58,000. Over the whole series since 2003 the average revision from first to third is plus 7,000, which is to say there is no built-in direction. Big prints get cut sometimes. They also get raised.
So "it will be revised away" is a real possibility with a real base rate, not a certainty. A 58,000 haircut leaves August at 104,000, which would still be the best month since April. It would take a May-sized cut to make it ordinary.
What does the market expect September payrolls to be?
There is a cleaner way to ask whether traders think August was a mirage. Ask them what September will be. Kalshi's September payrolls ladder is open now and settles on Oct. 2. Here it is next to what the August ladder looked like before Friday's print.
| Kalshi contract: jobs added above... | August ladder, 8 a.m. Sept. 4 | September ladder, Sept. 7 |
|---|---|---|
| 0 | 74 cents | 86 cents |
| 50,000 | 45 cents | 54 cents |
| 100,000 | 13 cents | 25 cents |
| 125,000 | 10 cents | 11-19 cents (wide market) |
| 150,000 | 10 cents | Not yet listed |
The September ladder's midpoint is about 60,000. That is mean reversion, not payback. The crowd is not pricing a negative print that unwinds August, and it is not pricing a repeat. It is pricing August as an outlier and September as a normal month, with a 1-in-4 chance of another six-figure surprise. If you believe the mirage story hard enough to think September comes in below zero, the market will sell you that at about 14 cents.
That is roughly what the Fed contract is saying too. If traders thought 162,000 was the new trend, the hike contract would not have stopped at 50.
What settles the hike-or-hold argument before Sept. 16?
August inflation, and Waller told you so: what settles this. In his Sept. 3 speech he said his September vote "will be heavily influenced by what we learn about August inflation," and he was explicit in both directions: "If there is continued progress toward our 2 percent goal, then I am willing to support holding the policy rate at its current level. But if inflation comes in hot, I would consider a rate hike."
The August CPI is released Thursday, Sept. 11 at 8:30 a.m. ET. Here is the setup. July CPI ran 3.4% over the year, with core at 2.5%. Energy was up 14.7% and gasoline 24.6% over the year, which is why headline and core are so far apart. On the Fed's preferred measure, PCE inflation is 3.7% over 12 months and 4.1% over six, per Warsh at Jackson Hole. Core PCE is 3.3%. Waller's point is that the three-month core rate has come down steadily from 4.76% in February to 3.05% through July, and he wants to see that continue.
Kalshi has the CPI ladder up. As of Sept. 7:
| Kalshi contract: August CPI, year over year, above... | Price |
|---|---|
| 3.2% | About 90 cents |
| 3.3% | 56 cents |
| 3.4% | 22 cents |
| 3.5% | 5 cents |
Run the math and the crowd puts about a 10% chance on 3.2% or lower, a 34% chance on exactly 3.3%, another 34% on 3.4%, roughly 17% on 3.5% and 5% above that. The month-over-month ladder centers on 0.3%, with a 13% chance of 0.4% or more.
That distribution is the whole ballgame. A 3.2% print is disinflation continuing, and it hands Waller his hold. A 3.5% print is inflation coming in hot, with an unemployment rate at full employment and a payroll number the hawks can wave around. The fat middle, 3.3% to 3.4%, which is about two-thirds of the distribution, settles nothing. That is why the Fed contract sits at 50.
If you want to see what a given CPI print should do to your own hike probability, our Bayes updater takes a prior and a likelihood and gives you the number. Start at 51%.
So what side are you on?
Both stories are internally consistent. That is the uncomfortable part. Here is what each has to be right about between now and 2 p.m. on Sept. 16.
If you are on the hike side, you need: a CPI print of 3.4% or higher on Thursday, which the ladder prices at roughly 56%; the household survey and the workweek to hold up as the truer signal than the two seasonal categories; and a committee that, at 3.7% PCE and 4.1% unemployment, decides waiting for revisions is not a reason to wait. The July dissenters are already there. You need two or three more.
If you are on the hold side, you need: a CPI print of 3.3% or lower, which the ladder prices at roughly 44%; Waller's conditional to hold, which brings the governors with him; and the seasonal-mirage read to be the one the staff briefs the committee on. You also get a free option: the first revision to August comes after the vote, so a committee that wants to wait has a ready-made reason.
Here is how the two beliefs trade. The Kalshi contract is KXFED-26SEP-T3.75, "will the upper bound of the federal funds rate be above 3.75% following the Sept. 16 meeting." It is the most traded strike in the series. "Yes" at 52 cents is the hike side. "No" at 49 cents is the hold side. Both pay $1 if right. The market is telling you, at these prices, that it cannot tell the difference. If you can, that is the edge.
The same crowd is more confident about the direction over the rest of the year. Kalshi prices "above 3.75% after the Dec. 9 meeting," meaning at least one hike by December, at 75 to 80 cents, and "above 4.00%," at least two hikes, at 36 to 37 cents. Those December contracts price a cumulative level, not the December meeting alone, so they cannot be compared to a Polymarket or futures number for that meeting; the only apples-to-apples venue comparison is September, and the September meeting page keeps the scorecard.
We are not going to pick a side in print. We will say this: the market has priced the jobs report as roughly half real, and it has priced Thursday as the decider. If the argument in your group chat is about the seasonal factor, you are arguing about six cents. The other 44 are about a number nobody has seen yet.
Where can you watch the Fed odds live?
The live board, same one as above, updating every 30 minutes through the meeting:
Between now and the decision, the Fed Rate Tracker carries the three-venue board, the nonfarm payrolls and unemployment indicator pages, and the core PCE page Waller is watching. The Inflation Tracker has the CPI ladder, and Macro Pulse has the rest of the calendar. If you would rather ask an AI, our MCP server gives any assistant the same live numbers, free, no key required.
Embed the live board on your own site:
<iframe src="https://predictionmarketspicks.com/embed/fed-rate-tracker/article?theme=indigo" width="100%" height="400" style="border:0;max-width:728px" loading="lazy" title="Live Fed rate decision odds from prediction markets"></iframe>We will grade the September contract the evening of Sept. 16 on the meeting page, and we will come back to the August number on Oct. 2 when the first revision prints. One of the two stories in this piece is going to look obvious in hindsight. It always does.
All prediction market prices as of Sept. 7, 2026, from PredictionMarketsPicks' 30-minute capture of Kalshi, Polymarket and CME fed funds futures and from Kalshi's public market data. Polymarket prices are from the international book. Jobs figures from the BLS Employment Situation for August 2026 and the BLS CES revisions table; unadjusted category detail and quotes from Piedmont Crescent Capital's Sept. 4 analysis; Bloomberg Economics, Schwab and RSM comments as reported by Yahoo Finance on Sept. 5; Treasury and bitcoin moves per CoinDesk on Sept. 7. Prediction market contracts involve risk of loss. This is not financial advice.