

Every August the same thing happens in the prop world. A projection site drops its numbers, the "locks" thread goes up, a few green screenshots make the rounds, and nobody — ever — circles back to grade the whole set. Prop projections get sold constantly and measured almost never.
So we measured ours.
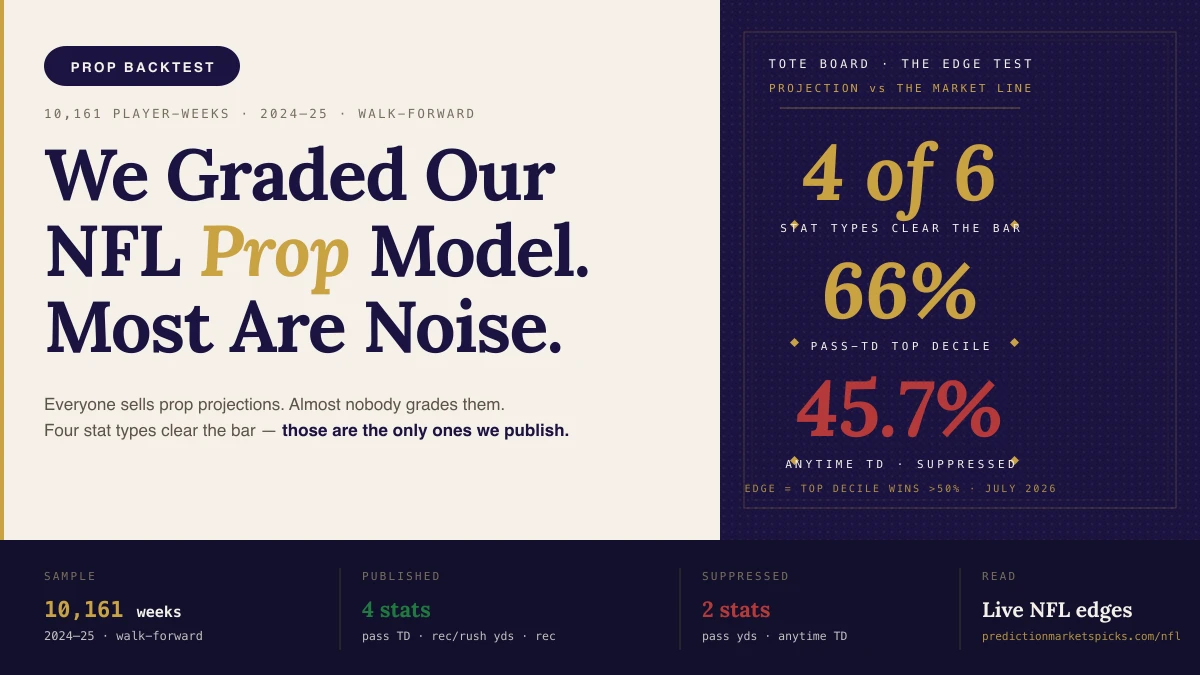
We took the Gridiron Edge player-projection engine, replayed two full seasons of it play by play, and graded every material prop it produced against what actually happened — 10,161 graded player-weeks across 2024 and 2025, weeks 4 through 17. The headline is not flattering to the category, and that's the point: most player props are coin flips, even with a real model behind them. Four stat types aren't. Those four are the only ones we publish.
Want the live version? The current reads and edges run on the Sports board; the full game-model methodology lives at How Gridiron Edge Works.
How we graded it
The method matters more than the number, so here it is in plain English.
- Walk-forward, no leakage. To project a week, the engine only sees games that came before it. Nothing about Week 12 ever informs a Week 6 projection. Same discipline behind our game model and our 20-year Madden backtest.
- Every material prop, both seasons. Passing yards and touchdowns, rushing yards, receiving yards, receptions, and anytime touchdown — 10,161 projected-vs-actual player-weeks in total.
- The honest caveat, up front. There is no historical Kalshi prop price to replay — those markets are new. So the backtest grades each projection against a market proxy: the player's own trailing per-game average through prior weeks. That measures signal versus a baseline. It does not prove we beat a real closing price. (We get to that at the end — it's the whole reason the live ledger exists.)
The bar isn't accuracy. It's the edge test.
Here's where most "our MAE is low!" pitches fall apart. A prop edge is about being right at a line, not about minimizing average error against a season number. You can nail a receiver's yardage to within a few yards every week and still have no idea which side of the market line to take.
So the bar we hold every stat to is the edge test:
> Rank every projected edge into deciles. The top decile — our highest-conviction overs and unders — has to win more than 50% at the market line, and it has to out-hit the bottom decile. If bigger projected edges don't actually win more, the model isn't sorting signal. Suppress it.
Point accuracy is context. The edge test is the gate.
The results
Six stat types went in. Four came out.
| Stat | Graded n | Top-decile hit | Bottom-decile hit | Edge lift | Clears bar? |
|---|---|---|---|---|---|
| Passing TDs | 590 | 66.1% | 52.5% | +13.6pp | ✅ |
| Receiving yards | 2,483 | 61.7% | 52.0% | +9.7pp | ✅ |
| Rushing yards | 1,173 | 57.3% | 44.4% | +12.8pp | ✅ |
| Receptions | 2,540 | 53.5% | 44.1% | +9.4pp | ✅ |
| Passing yards | 593 | 45.8% | 44.1% | +1.7pp | ❌ |
| Anytime TD | 2,782 | 45.7% | 49.3% | −3.6pp | ❌ |
Read the two failures closely, because they're instructive. Passing yards is nearly as accurate as the trailing-average baseline on raw error — but its edge ranking is flat. The top decile wins 46%, barely different from the bottom. The residual is week-to-week attempt variance that trailing volume simply can't see coming, and you can't rank a line off noise.
Anytime touchdown is worse: negative lift. Our highest-conviction picks hit less than our lowest. A Poisson touchdown rate built from rushing and receiving usage does not sort scorers — touchdowns are too lumpy and too close to the goal line. Every site in the space sells "anytime TD" as its hero product. Ours doesn't clear the bar, so we don't sell it.
The four that pass — passing TDs, receiving yards, rushing yards, receptions — top out between 54% and 66% in the highest-conviction decile, with clean positive lift. That's a real, publishable edge.
The part nobody advertises: the grader caught our own bugs
Building the grader is where it earned its keep. When you actually score a model against reality, it tells on itself — and ours did. Three engine bugs surfaced, all in the quarterback projections:
- A stale, column-pruned data cache was silently defaulting every efficiency stat — for a stretch, every quarterback was getting the same yards-per-attempt and nearly identical projected passing yards.
- Yards-per-attempt was accidentally yards-per-completion — incompletions were being dropped from the average, inflating passing-yard projections by roughly 1.6×.
- Passing volume was a spread-generic team number with essentially zero player signal — the correlation between projected and actual attempts was about −0.02.
We fixed all three. Passing-yard error dropped from an ugly 133 down to 69.8, and passing touchdowns crossed the edge test in the process (top-decile hit climbed from 42% to 66%). None of that gets found if you never grade the model. A projection you can't audit is a guess with a logo on it.
One more caveat, because it's the honest one: calibration
Even on the four stats that pass, the raw over/under probability runs hot — predicted 60% overs have been realizing in the mid-to-high 40s. So before any probability is shown or sized on, it gets a calibration pass. The direction of the edge is real; the exact number gets tightened before it's in front of you or feeding a Kelly stake.
Why we suppress the other two
This is the whole ethos. We could publish passing-yard and anytime-TD "projections" tomorrow — they'd look identical to what everyone else posts, and plenty of them would win, because coin flips win half the time. But we'd be charging for noise. Suppressing the two stats that fail is the same instinct as grading the four that pass: surface what clears the bar, hide what doesn't, and tell you which is which.
The live ledger — ongoing proof, in public
The backtest graded against a proxy line. The real test is beating an actual closing price, and that's only provable live. So starting this season, the moment Kalshi posts a prop we've flagged, we record two prints: our entry price when we flag it, and the close right before kickoff. The gap — signed to the side we took — is our closing line value on that prop. Positive CLV means the market moved to our side after we called it. That ledger populates only for the four surfaced stats, week by week, and it either holds up or it doesn't. In public.
And to be clear about what's what: the Gridiron Edge game model posts a 59.6% walk-forward win record across 3,266 games. That's a moneyline number. It says nothing about props, and we never blend the two. Prop performance carries its own graded track record, reported on its own. Blending them would be marketing. We'd rather show you the measurement.
That's the whole pitch, honestly: a projection is only worth what it grades out to. See the live NFL reads and edges — and hold the numbers to the bar.
Prediction markets carry real risk. Trade responsibly, size with a Kelly stake, and never take a position you can't afford to be wrong on.