Remember Beanie Babies? Specifically that one weird purple bear your aunt swore was going to put your cousin through college? Yeah. Most longshots are that bear. Worthless, dusty, embarrassing in the family photo album.
But every so often a longshot is the real one. The Pokémon card you bought for two bucks at the gas station that's worth three grand twenty years later. The 2¢ contract on Polymarket that paid like a Powerball ticket without the 1-in-292-million math.
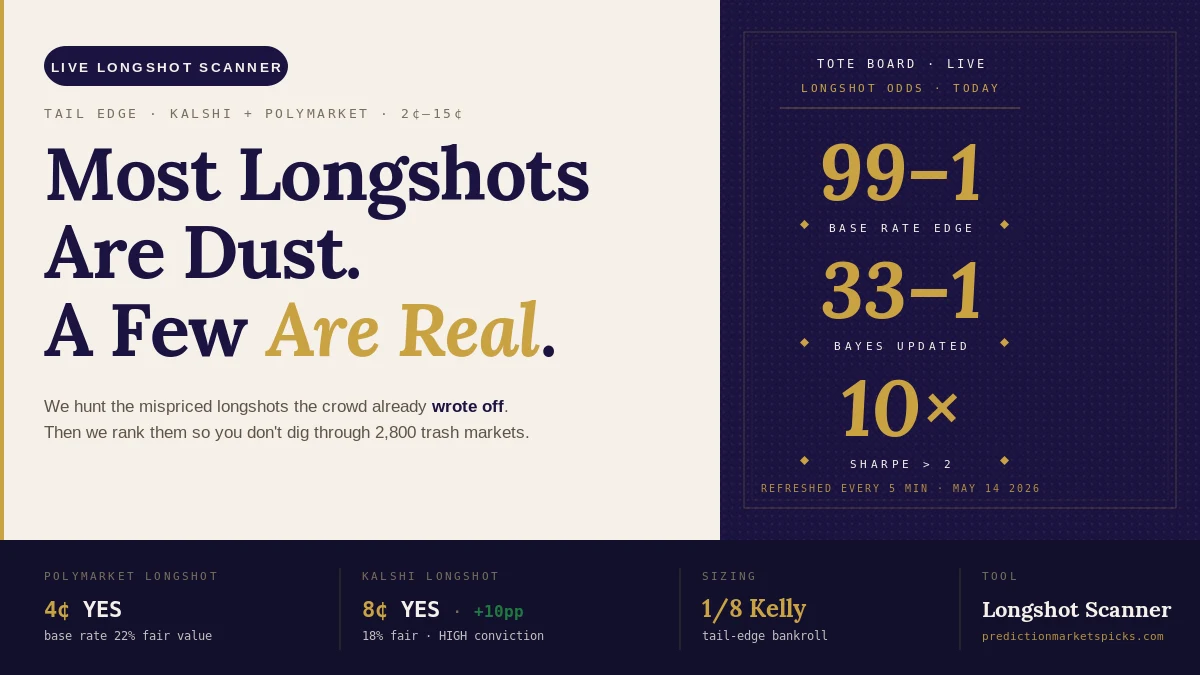
The Live Longshot Scanner is the tool we built to tell those two things apart. It runs around the clock. It scans Kalshi and Polymarket. It surfaces contracts the crowd has written off as impossible — but where the actual base rate, history, and order book say the market is asleep at the wheel. Then it ranks them so you don't have to dig through 2,800 trash markets to find the one worth a second look.
Here's how it works in plain English. No matrices. No Greek letters. Just the read.
What "longshot" actually means in a prediction market
When a contract trades at 4¢ on Polymarket or Kalshi, the market is telling you it thinks there's a 4% chance of YES. That's the entire language. It's a literal probability, in cents, on a scale of 0 to 100.
Most of those 4¢ contracts are correctly priced. Things that probably won't happen, priced like they probably won't happen. Boring. Move on.
But sometimes the market is lazy. The price drifted to 4¢ three weeks ago, nobody cared, no new info has come in, and the contract just sits there gathering dust like a Tamagotchi nobody fed since 1998. Meanwhile the actual probability of YES — based on history, base rates, and what we can observe — might be 9% or 12%. That gap is the entire game.
The Scanner looks for those gaps. Not in a vibes way. In a "here's the math, here's the comparison, here's why it's flagged" way.
Why every other tool ignores the longshots
Most edge-finder tools are tuned for the fat middle — contracts trading between 30¢ and 70¢. That makes sense. Liquidity is thicker there, spreads are tighter, the math is forgiving, and a 5-point mispricing is meaningful without being weird.
The tails — sub-10¢ and 90¢-plus — get ignored because:
1. Spreads are wider than the price itself. A 4¢ contract with a 3¢ spread looks unscannable.
2. Volume is lumpy. Most of these markets see five trades a day.
3. The math is different. Tail strategies need calibration, not just edge detection.
4. Most retail tools are scared of the optics. Telling a free user "look at this 3¢ contract" without context is a quick way to get lit up on Reddit when it loses.
We're not scared of any of that. We just decided to build the calibration layer first, then surface the picks. Different order of operations, different result.
How the Scanner finds the real ones
Three layers. Plain-English versions:
Layer 1: Persistence. This is the "has the price stopped moving" check. The bot in that famous "Markov Model" screenshot dressed up a basic stickiness filter in a fake mustache and called it advanced math. We just call it persistence because we're not in the business of pretending high-school probability is rocket science. The idea is simple: if a contract has been sitting at 4¢ for six straight hours without moving, the market has fallen asleep on it. Sleeping markets are the ones most likely to be wrong.
Layer 2: Base rate analog. For every persistent longshot, we look up similar contracts that already resolved. Same platform, same event type, same low-price entry point. We pull the historical resolution rate.
Here's a worked example so the abstraction has a face. Imagine a Polymarket contract that asks "Will [obscure third-party candidate] win the New Hampshire primary?" priced at 3¢. By itself, that's just a price. The base-rate analog query asks: across the last four cycles, of all third-party primary candidates who entered the race polling under 5%, how often did one of them actually win a state primary? Pull the n. Pull the resolution rate. If history says n=64 analog contracts, of which six resolved YES, the empirical base rate is 9%. The market is pricing 3%. The gap is six points — meaningful for a tail trade, and meaningful in a way the price alone can't tell you.
That's the edge. Not the price. Not the persistence. The gap between what history says and what the market is charging today, anchored by a real sample size.
We require a minimum of 30 analogs before the base rate gets used at all. Below 30 you're not estimating a probability — you're guessing with extra steps. Above 30 the math starts to behave. Above 50 it's load-bearing. The Scanner shows the n on every signal so you can see how thin or thick the historical anchor is. Thin samples get the SPECULATIVE tier. Thick samples are where the STRONG signals come from.
The dirty secret of longshot trading is that nobody else does this lookup. Most people see 3¢, think "that's so cheap, the upside is huge," and click buy on vibes. The work is the analog query — and the calibration that comes from honestly tracking what those analogs went on to do.
Layer 3: Liquidity gate. A signal you can't fill is not a signal — it's a screensaver. We require the parent event to have at least $10,000 of 24-hour volume so you can actually take a position. No paper longshots.
A signal has to clear all three layers to make the board.
Why our own fat-middle scanner can't do this job
We already publish a Polymarket Mispricing Scanner that runs every morning and flags fat-middle gaps using a two-agent Bayesian swarm. People reasonably ask: why not just point that engine at sub-10¢ contracts?
Because the math breaks. Here's why.
The fat-middle scanner uses Kalshi cross-reference as its primary signal — when Kalshi and Polymarket both list the same question and disagree, that disagreement is the edge. At 50¢ a 5-point gap is a 10% relative mispricing. The signal is loud enough to act on. At 3¢, a 5-point gap is a 167% relative mispricing — but the absolute prices on Kalshi's side are typically too thin, too wide-spread, or simply not quoted to give you a usable cross-reference. The Bayesian swarm produces a posterior, but the confidence weight collapses because no one source is liquid enough.
The fat-middle scanner also uses Kelly criterion sizing tuned for ~5pp edges on 30¢-70¢ contracts. The Kelly formula behaves badly at the tails: quarter-Kelly on a 4¢ contract with a stated +6pp edge wants you to bet a large fraction of bankroll, which is exactly the opposite of what tail strategy demands. Tails need flat-sized small positions across many trades, because the win distribution is lumpy. A single 10:1 winner pays for nine losers.
So we built a different engine. Persistence as the entry filter (because tail markets are sleeping, not fighting). Base-rate analog as the probability anchor (because Kalshi cross-reference doesn't exist down there). Flat sizing guidance instead of Kelly (because the math is asymmetric). Same general philosophy — find where the market is asleep — different toolkit. Two scanners, two scopes, one workflow.
If the contract you're looking at is between 20¢ and 80¢, use the Mispricing Scanner. If it's below 10¢ or above 90¢, this is the one. The tools don't overlap. They tag-team.
The tier system, AKA "how seriously to take it"
Three tiers. Color-coded. Honest about what they mean.
STRONG. Edge of 5 points or more, persistence of 0.85 or higher, at least 50 historical analogs anchoring the base rate. These are the signals that go to Discord and that we'd consider writing home about. Still not guaranteed. Nothing is. But the math, the history, and the order book all agree this is the real bear, not the dusty one.
MODERATE. Edge of 3 points or more, persistence of 0.75 or higher, at least 30 analogs. Worth a look. Worth a small position. Not worth a Twitter chest-thump.
SPECULATIVE. The math sniffed something but the analog set is thin or the persistence is borderline. Watchlist material. Track it, see what happens, learn the shape of the market.
We don't push SPECULATIVE signals to Discord premium channels. Those live on the Pro dashboard tab. If you want a feed of "things that look interesting but I'm not certain about," that's where you live.
How to actually use the Scanner
The tab lives on /tools/mispricing-scanner. Pro subscribers see the full list. Free users see the count of active STRONG signals plus a teaser row.
A workflow that actually works:
1. Open the tab once a day. Late morning ET is fine — most overnight movement has settled.
2. Filter to STRONG only.
3. For each one, click through to the market. Read the resolution criteria. Make sure you understand what YES actually requires. Read it twice if you have to. Resolution criteria are the Office Space "PC Load Letter" of prediction markets — the fine print where surprises live.
4. Check the base rate analog count. If the analog says n=12, the sample is too small to lean on. If it says n=87, that's a real history.
5. Size it like a longshot. Small position. The math only works if you take a lot of these and let the wins pay for the losses. One STRONG signal is not a paycheck. The portfolio is.
6. Set a hard exit. If the price drops to half your entry — say you bought at 4¢ and it falls to 2¢ — get out. If it rips to 15¢, take some off. Same discipline as every other trade.
This is not a back-up-the-truck tool. It's a "make 30 small reads a quarter and let the math do its job" tool. Different game, different rules.
What the Scanner is not
It's not picks. It's a watchlist with calibration attached. The right number to expect from a STRONG signal is its base rate — call it 8 to 10 percent on average. Most of these will lose. That's the design. The whole point is the wins pay 10:1 or 20:1, so a 12% hit rate is profitable.
It's not a magic bot. There is no Markov model doing anything mystical. The math is high-school probability with a base-rate lookup attached. The reason it works is not that the math is fancy — it's that nobody bothers to do this work systematically on the cheap end of the order book.
It's not a get-rich tool. Anyone selling you that is either a YouTuber who needs new sneakers or a federal investigation waiting to happen. We're selling you a clean look at where the market might be sleeping. What you do with it is on you.
Calibration, because it matters more than anything
Every signal we publish gets tracked. When the contract resolves, the Scanner writes the outcome back to its history. Once a quarter we publish the calibration: of 100 STRONG signals, X resolved YES, base rate said Y. If we're under-calibrated, you'll see it. If we're hot, you'll see it. That visibility is the whole product.
The reason most edge tools die is that they never publish calibration. They post wins. They quietly delete losses. Twenty years of running small businesses taught me that's the fastest way to lose customers who actually matter — the ones who'll stick with you for ten years instead of ten weeks. So we're doing the boring honest version. Show the work. Eat the bad quarters when they come.
Where this fits in the stack
The Scanner pairs naturally with three other tools we already publish:
- Mispricing Scanner (main tab) — the fat-middle version of this same logic, looking at 20¢-80¢ contracts.
- Bayes Updater — for when you want to plug in your own prior and stress-test a price.
- Kelly Calculator — for sizing once you've decided to take a position.
Use them together. The Scanner gives you the candidate. The Bayes Updater lets you sanity-check the base rate against your own read. The Kelly Calculator tells you how much to put on it. Three reads, one position. That's the workflow.
Bottom line
Most longshots are dusty Beanie Babies. A few are the real ones. The Live Longshot Scanner exists to do the unglamorous work of telling them apart, then publishing what it found, then tracking how it actually does. That's the whole pitch. No animations, no bots, no 1,150% per trade theater. Just a clean read on the cheap end of the order book.
If that's the kind of edge you want in your toolkit, the Scanner lives here and you'll need a Pro account to see the full board. Trade responsibly.